## Line Charts: Model Performance Comparison (pass@K)
### Overview
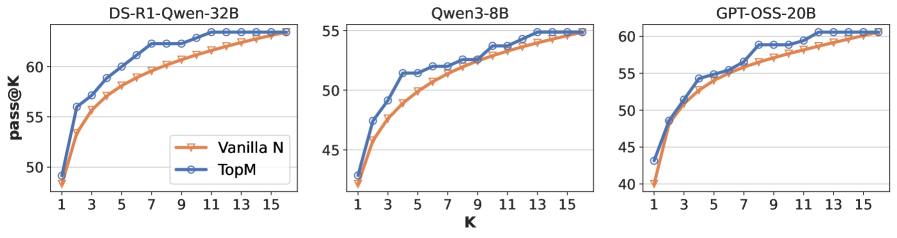
The image displays three horizontally arranged line charts comparing the performance of two methods ("Vanilla N" and "TopM") across three different language models. The metric is "pass@K," plotted against the parameter "K." All charts show an increasing trend for both methods as K increases.
### Components/Axes
* **Titles (Top-Center of each subplot):**
* Left Chart: `DS-R1-Qwen-32B`
* Middle Chart: `Qwen3-8B`
* Right Chart: `GPT-OSS-20B`
* **Y-Axis Label (Leftmost chart):** `pass@K`
* **X-Axis Label (Centered below all charts):** `K`
* **Legend (Bottom-right corner of the leftmost chart):**
* `Vanilla N`: Orange line with plus (`+`) markers.
* `TopM`: Blue line with circle (`o`) markers.
* **Axis Scales:**
* **X-Axis (K):** Linear scale from 1 to 15, with major ticks at every odd number (1, 3, 5, 7, 9, 11, 13, 15).
* **Y-Axis (pass@K):** Linear scales differ per chart:
* DS-R1-Qwen-32B: ~48 to ~63
* Qwen3-8B: ~42 to ~55
* GPT-OSS-20B: ~40 to ~61
### Detailed Analysis
**1. DS-R1-Qwen-32B (Left Chart)**
* **Trend:** Both lines show a steep initial rise that gradually flattens. The `TopM` (blue) line is consistently above the `Vanilla N` (orange) line.
* **Approximate Data Points:**
* **K=1:** Vanilla N ≈ 49, TopM ≈ 49 (nearly identical start).
* **K=3:** Vanilla N ≈ 55, TopM ≈ 56.
* **K=7:** Vanilla N ≈ 59, TopM ≈ 62.
* **K=15:** Vanilla N ≈ 63, TopM ≈ 63 (converge at the highest K).
**2. Qwen3-8B (Middle Chart)**
* **Trend:** Similar logarithmic growth pattern. The performance gap between `TopM` and `Vanilla N` is smaller here than in the first chart.
* **Approximate Data Points:**
* **K=1:** Vanilla N ≈ 43, TopM ≈ 44.
* **K=5:** Vanilla N ≈ 49, TopM ≈ 51.
* **K=11:** Vanilla N ≈ 53, TopM ≈ 54.
* **K=15:** Vanilla N ≈ 55, TopM ≈ 55 (very close convergence).
**3. GPT-OSS-20B (Right Chart)**
* **Trend:** Consistent upward trend. `TopM` maintains a clear and steady lead over `Vanilla N` across the entire range of K.
* **Approximate Data Points:**
* **K=1:** Vanilla N ≈ 40, TopM ≈ 43.
* **K=5:** Vanilla N ≈ 53, TopM ≈ 55.
* **K=9:** Vanilla N ≈ 57, TopM ≈ 59.
* **K=15:** Vanilla N ≈ 61, TopM ≈ 61 (converge at the final point).
### Key Observations
1. **Universal Superiority of TopM:** In all three models and at nearly every measured value of K, the `TopM` method yields a higher `pass@K` score than the `Vanilla N` method.
2. **Diminishing Returns:** The rate of improvement for `pass@K` slows as K increases for both methods, following a characteristic logarithmic curve.
3. **Convergence at High K:** For the DS-R1-Qwen-32B and Qwen3-8B models, the performance of the two methods becomes nearly indistinguishable at the highest measured K value (K=15). For GPT-OSS-20B, they converge at the final point.
4. **Model-Specific Scaling:** The absolute `pass@K` values and the size of the performance gap between methods vary by model. The DS-R1-Qwen-32B model shows the largest initial gap, while the Qwen3-8B model shows the smallest.
### Interpretation
This data demonstrates the effectiveness of the `TopM` method over the `Vanilla N` baseline for improving the pass@K metric across diverse model architectures and sizes. The `pass@K` metric typically measures the probability that at least one of K generated samples is correct. The consistent advantage of `TopM` suggests it is a more reliable sampling or ranking strategy for generating correct outputs, especially when the budget for attempts (K) is low to moderate.
The convergence at high K indicates that given enough attempts, the simpler `Vanilla N` method can eventually match the performance of the more sophisticated `TopM` method. Therefore, the primary value of `TopM` lies in **efficiency**—achieving higher success rates with fewer generations, which translates to reduced computational cost and latency. The variation across models implies that the benefit of `TopM` may depend on the underlying model's capabilities or training, being most pronounced in the DS-R1-Qwen-32B model in this comparison.