## Line Graphs: Model Performance Comparison Across Datasets
### Overview
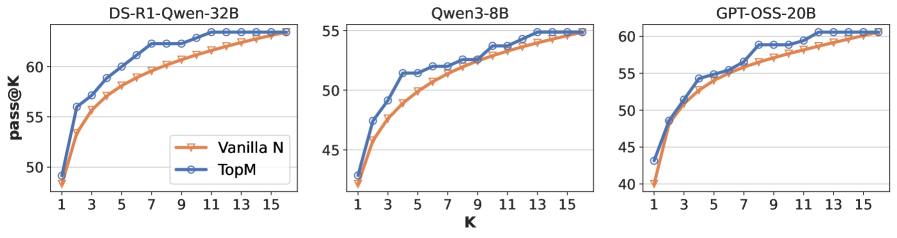
The image contains three line graphs comparing the performance of two models ("Vanilla N" and "TopM") across three datasets: "DS-R1-Qwen-32B", "Qwen3-8B", and "GPT-OSS-20B". Each graph plots "pass@K" (y-axis) against "K" (x-axis), showing how performance improves as K increases. Both models exhibit similar upward trends, with "TopM" consistently outperforming "Vanilla N" slightly.
---
### Components/Axes
1. **X-Axis (K)**:
- Labeled "K" with discrete values: 1, 3, 5, 7, 9, 11, 13, 15.
- Represents the number of top candidates considered for evaluation.
2. **Y-Axis (pass@K)**:
- Labeled "pass@K" with values ranging from 40 to 65.
- Measures the percentage of successful outcomes (e.g., correct predictions) within the top K candidates.
3. **Legends**:
- Positioned in the **bottom-left** of each graph.
- "Vanilla N" is represented by **orange triangles** (▲).
- "TopM" is represented by **blue circles** (●).
4. **Graph Titles**:
- Top-left corner of each graph specifies the dataset:
- "DS-R1-Qwen-32B"
- "Qwen3-8B"
- "GPT-OSS-20B"
---
### Detailed Analysis
#### DS-R1-Qwen-32B
- **Vanilla N**: Starts at ~48 (K=1), rises sharply to ~63 (K=15).
- **TopM**: Starts at ~49 (K=1), rises to ~63 (K=15).
- **Trend**: Both lines converge at K=15, with TopM maintaining a ~1-2 point advantage throughout.
#### Qwen3-8B
- **Vanilla N**: Begins at ~42 (K=1), increases to ~54 (K=15).
- **TopM**: Starts at ~43 (K=1), rises to ~55 (K=15).
- **Trend**: TopM outperforms Vanilla N by ~1-2 points across all K values.
#### GPT-OSS-20B
- **Vanilla N**: Starts at ~44 (K=1), climbs to ~60 (K=15).
- **TopM**: Begins at ~45 (K=1), reaches ~61 (K=15).
- **Trend**: TopM maintains a ~1-2 point lead, with both models showing steep initial growth.
---
### Key Observations
1. **Consistent Performance Gap**: "TopM" outperforms "Vanilla N" by 1-2 points across all datasets and K values.
2. **Diminishing Returns**: Performance improvements slow as K increases, especially after K=9.
3. **Dataset Variability**: "GPT-OSS-20B" shows the largest absolute performance gap (~16 points at K=15), while "Qwen3-8B" has the smallest (~3 points at K=15).
---
### Interpretation
The data suggests that "TopM" is a more effective model variant, likely due to architectural optimizations or training strategies. The marginal performance gap implies that while "TopM" is superior, the difference may not justify additional computational costs in all scenarios. The convergence of lines at higher K values indicates that both models saturate at similar performance ceilings, but "TopM" achieves this faster. This could reflect better candidate prioritization or filtering mechanisms in "TopM".