## Bar Chart: Success Rate Comparison Across Tasks
### Overview
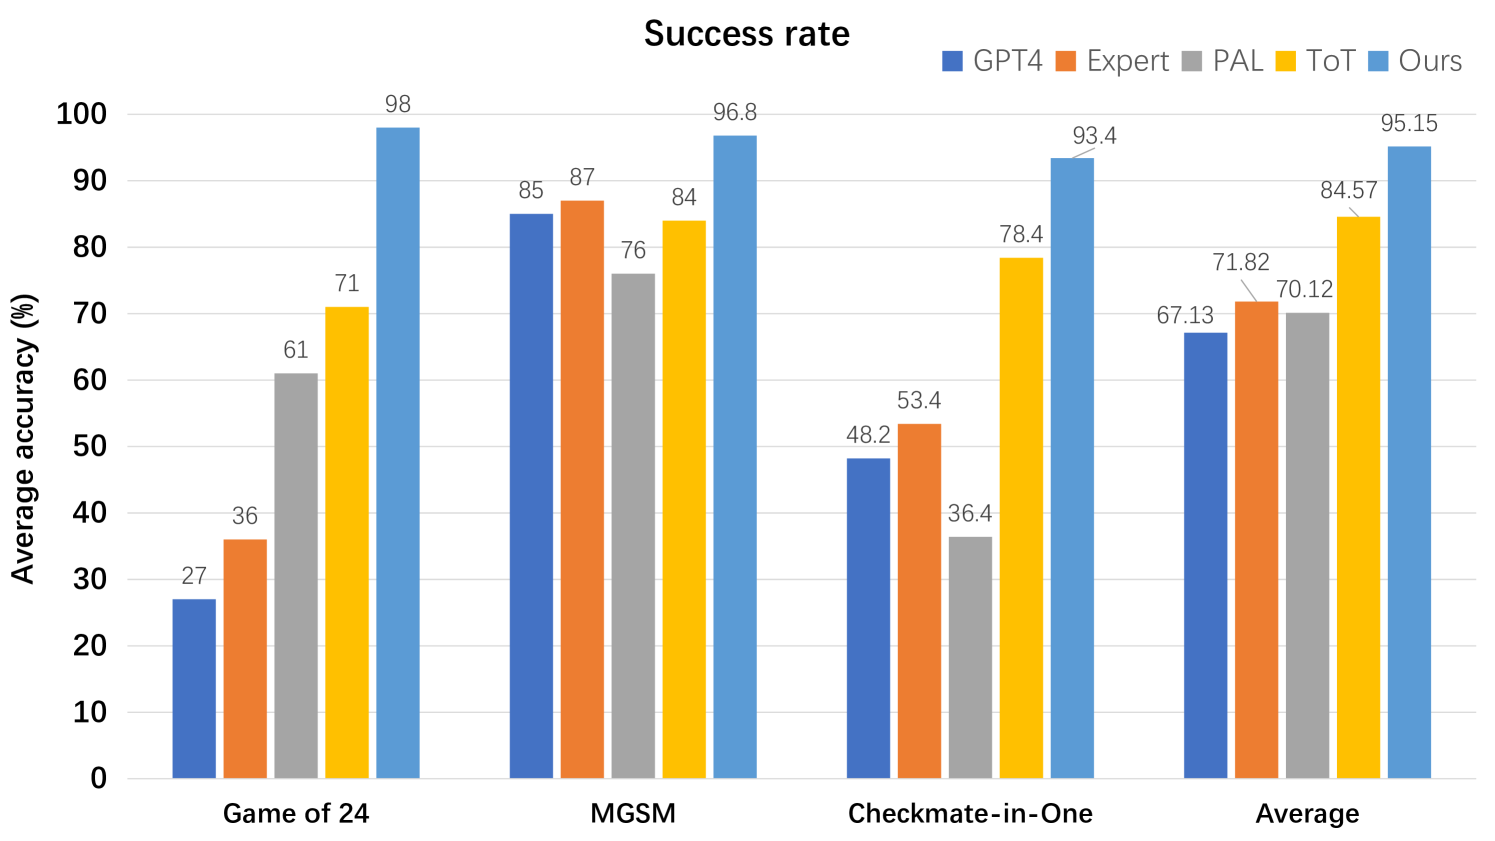
This is a grouped bar chart titled "Success rate" that compares the performance of five different methods or models across three specific tasks and an overall average. The performance metric is "Average accuracy (%)".
### Components/Axes
* **Chart Title:** "Success rate" (centered at the top).
* **Y-Axis:** Labeled "Average accuracy (%)". The scale runs from 0 to 100 in increments of 10.
* **X-Axis:** Represents four distinct categories or tasks:
1. Game of 24
2. MGSM
3. Checkmate-in-One
4. Average
* **Legend:** Located in the top-right corner. It defines five data series by color:
* **GPT4:** Dark blue square.
* **Expert:** Orange square.
* **PAL:** Gray square.
* **ToT:** Yellow square.
* **Ours:** Light blue square.
* **Data Labels:** Each bar has its exact numerical value displayed at the top.
### Detailed Analysis
The chart presents the following data points for each task category. The trend within each task group is generally ascending from left (GPT4) to right (Ours), with some variation.
**1. Game of 24**
* **Trend:** Clear ascending trend from GPT4 to Ours.
* **Data Points:**
* GPT4 (Dark blue): 27%
* Expert (Orange): 36%
* PAL (Gray): 61%
* ToT (Yellow): 71%
* Ours (Light blue): 98%
**2. MGSM**
* **Trend:** Ascending trend, with "Ours" achieving the highest score. "Expert" slightly outperforms "GPT4".
* **Data Points:**
* GPT4 (Dark blue): 85%
* Expert (Orange): 87%
* PAL (Gray): 76%
* ToT (Yellow): 84%
* Ours (Light blue): 96.8%
**3. Checkmate-in-One**
* **Trend:** Ascending trend from GPT4 to Ours, with a significant jump for "ToT" and "Ours".
* **Data Points:**
* GPT4 (Dark blue): 48.2%
* Expert (Orange): 53.4%
* PAL (Gray): 36.4%
* ToT (Yellow): 78.4%
* Ours (Light blue): 93.4%
**4. Average**
* **Trend:** Consistent ascending trend from GPT4 to Ours.
* **Data Points:**
* GPT4 (Dark blue): 67.13%
* Expert (Orange): 71.82%
* PAL (Gray): 70.12%
* ToT (Yellow): 84.57%
* Ours (Light blue): 95.15%
### Key Observations
1. **Dominant Performance:** The method labeled "Ours" (light blue) achieves the highest accuracy in every single category, including the overall average.
2. **Task Variability:** The relative performance of the other methods varies by task. For example, "PAL" is the second-best on "Game of 24" but the worst on "Checkmate-in-One".
3. **Significant Gains:** The performance gap between "Ours" and the next-best method is most pronounced in the "Game of 24" (27 percentage points higher than ToT) and "Checkmate-in-One" (15 percentage points higher than ToT) tasks.
4. **Consistent Ranking:** In the "Average" column, the final performance ranking from lowest to highest is: GPT4 < PAL < Expert < ToT < Ours.
### Interpretation
This chart is designed to demonstrate the superior performance of a proposed method ("Ours") against several established baselines (GPT4, Expert, PAL, ToT) across a diverse set of reasoning or problem-solving tasks. The "Game of 24" is a mathematical puzzle, "MGSM" likely refers to a multilingual grade-school math benchmark, and "Checkmate-in-One" is a chess tactic problem. The consistent top placement of "Ours" suggests it is a more robust and effective approach for these types of challenges. The "Average" column synthesizes this advantage, showing a clear, incremental improvement over the other methods, with "Ours" achieving a 95.15% average accuracy. The chart effectively argues for the state-of-the-art capability of the presented method.