## Line Charts: Performance Metrics of Language Models
### Overview
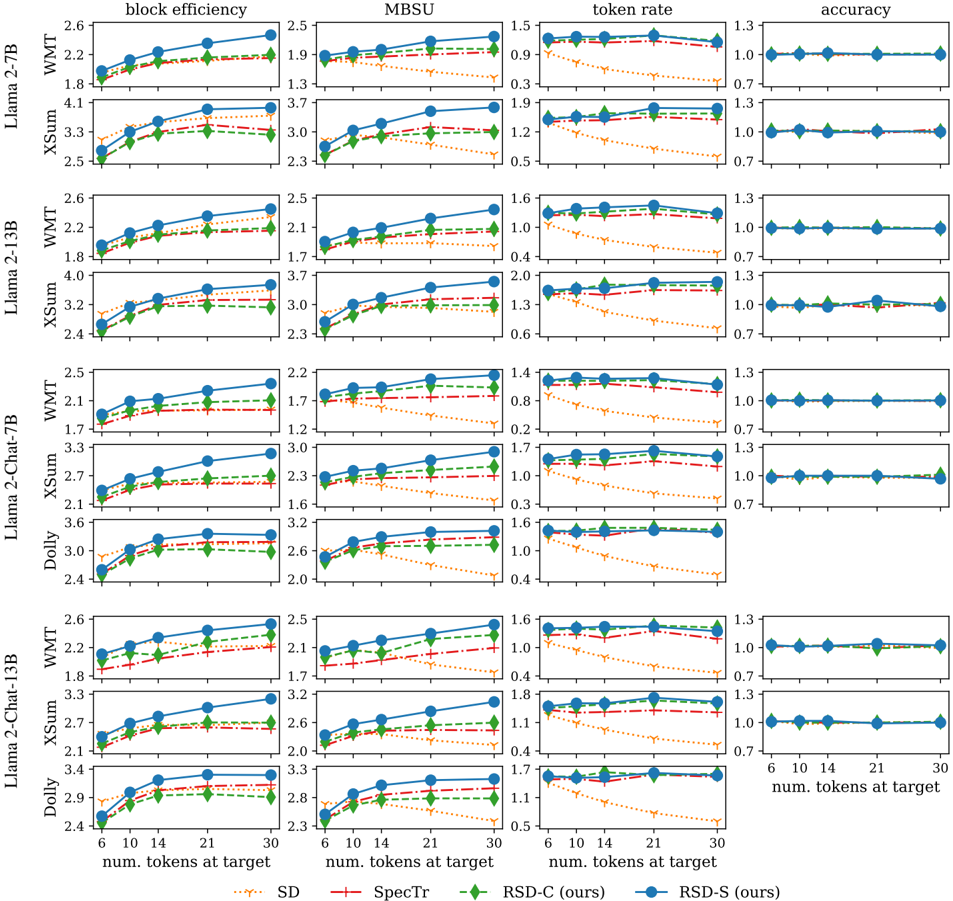
The image presents a series of line charts comparing the performance of different language models (Llama 2-7B, Llama 2-13B, Llama 2-Chat-7B, Llama 2-Chat-13B, and Dolly) across four metrics: block efficiency, MBSU, token rate, and accuracy. The x-axis represents the number of tokens at target (6, 10, 14, 21, 30), and the performance is evaluated on three datasets: WMT, XSum, and Dolly. Four different methods (SD, SpecTr, RSD-C (ours), and RSD-S (ours)) are compared for each model and metric.
### Components/Axes
* **Chart Titles (Top Row):** block efficiency, MBSU, token rate, accuracy
* **Y-Axis Labels (Left Column):** Llama 2-7B (WMT, XSum), Llama 2-13B (WMT, XSum), Llama 2-Chat-7B (WMT, XSum, Dolly), Llama 2-Chat-13B (WMT, XSum, Dolly)
* **X-Axis Label (Bottom):** num. tokens at target
* **X-Axis Markers:** 6, 10, 14, 21, 30
* **Y-Axis Markers:**
* **block efficiency:** Values range from approximately 1.7 to 4.1.
* **MBSU:** Values range from approximately 1.2 to 3.7.
* **token rate:** Values range from approximately 0.2 to 2.0.
* **accuracy:** Values range from approximately 0.7 to 1.3.
* **Legend (Bottom):**
* Blue line with circle markers: RSD-S (ours)
* Red dashed line with plus markers: SpecTr
* Green dashed-dotted line with diamond markers: RSD-C (ours)
* Orange dotted line with inverted triangle markers: SD
### Detailed Analysis
Each row represents a specific language model and dataset combination, and each column represents a different performance metric. Within each subplot, the x-axis represents the number of tokens at target, and the y-axis represents the value of the performance metric.
**Block Efficiency:**
* **General Trend:** For all models and datasets, block efficiency generally increases as the number of tokens at target increases.
* **RSD-S (ours) (Blue):** Consistently shows the highest block efficiency across all models and datasets.
* **SpecTr (Red):** Generally performs better than RSD-C and SD, but worse than RSD-S.
* **RSD-C (ours) (Green):** Performance is generally between SpecTr and SD.
* **SD (Orange):** Typically has the lowest block efficiency.
**MBSU:**
* **General Trend:** MBSU tends to increase with the number of tokens at target, but the increase is less pronounced than in block efficiency.
* **RSD-S (ours) (Blue):** Generally achieves the highest MBSU.
* **SpecTr (Red):** Performance is generally better than RSD-C and SD, but worse than RSD-S.
* **RSD-C (ours) (Green):** Performance is generally between SpecTr and SD.
* **SD (Orange):** Typically has the lowest MBSU.
**Token Rate:**
* **General Trend:** Token rate generally decreases as the number of tokens at target increases.
* **RSD-S (ours) (Blue):** Consistently shows the highest token rate across all models and datasets.
* **SpecTr (Red):** Generally performs better than RSD-C and SD, but worse than RSD-S.
* **RSD-C (ours) (Green):** Performance is generally between SpecTr and SD.
* **SD (Orange):** Typically has the lowest token rate.
**Accuracy:**
* **General Trend:** Accuracy remains relatively constant across different numbers of tokens at target.
* **RSD-S (ours) (Blue):** Consistently shows the highest accuracy across all models and datasets.
* **SpecTr (Red):** Generally performs better than RSD-C and SD, but worse than RSD-S.
* **RSD-C (ours) (Green):** Performance is generally between SpecTr and SD.
* **SD (Orange):** Typically has the lowest accuracy.
### Key Observations
* RSD-S (ours) consistently outperforms the other methods (SpecTr, RSD-C, and SD) across all four metrics (block efficiency, MBSU, token rate, and accuracy).
* SD generally has the lowest performance across all metrics.
* Accuracy remains relatively stable regardless of the number of tokens at target.
* The performance differences between the methods are more pronounced for block efficiency, MBSU, and token rate than for accuracy.
### Interpretation
The data suggests that RSD-S (ours) is the most effective method for improving the performance of language models, as it consistently achieves the highest block efficiency, MBSU, token rate, and accuracy. The other methods (SpecTr, RSD-C, and SD) offer varying degrees of improvement, with SD generally performing the worst. The relatively constant accuracy across different numbers of tokens at target suggests that the methods primarily impact efficiency metrics rather than the overall quality of the generated text. The consistent trends across different language models and datasets indicate that the performance benefits of RSD-S are generalizable.