## Line Chart: Model Performance Metrics Across Token Counts
### Overview
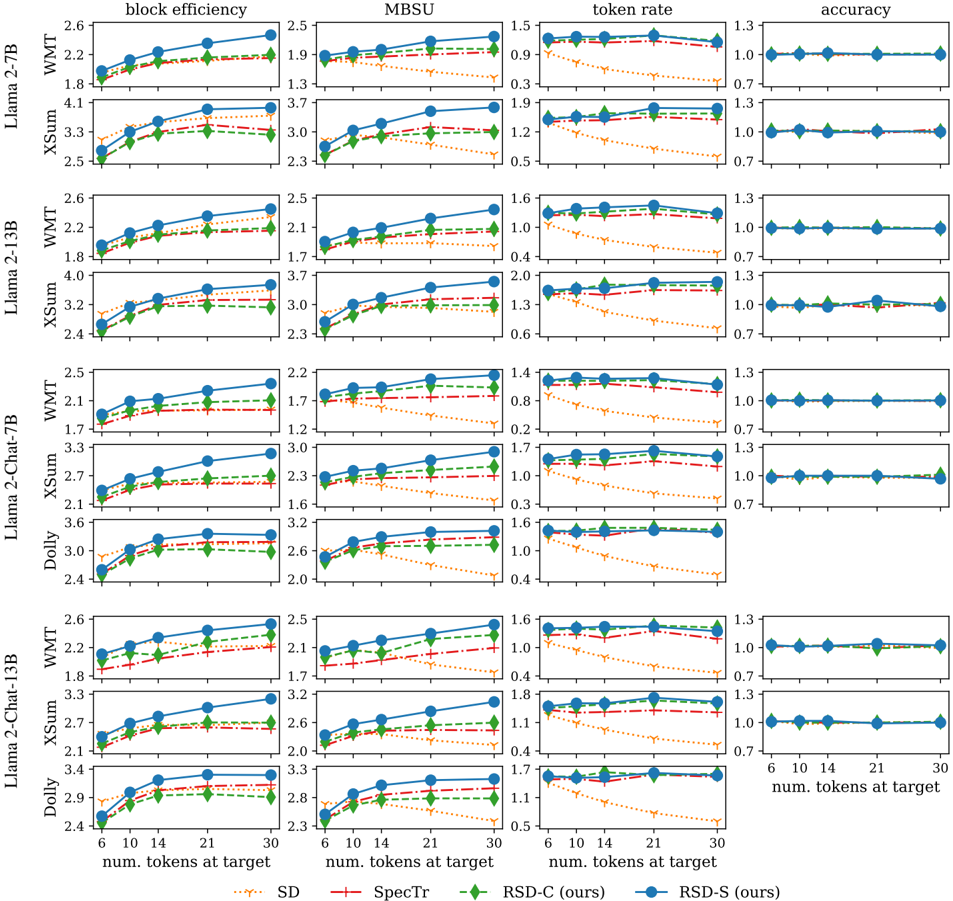
The image displays a multi-panel line chart comparing performance metrics (block efficiency, token rate, accuracy) across different language models (Llama 2-7B, Llama 2-13B, Llama 2-Chat-7B, Llama 2-Chat-13B, Dolly, XSum) and datasets (SD, SpecTr, RSD-C, RSD-S). Each panel represents a unique model-dataset combination, with three subplots per panel showing trends for the three metrics as the number of tokens at target increases from 6 to 30.
### Components/Axes
- **X-axis**: "num. tokens at target" (values: 6, 10, 14, 21, 30)
- **Y-axes**:
- Top row: "block efficiency" (scale: 1.5–2.6)
- Middle row: "token rate" (scale: 0.3–1.5)
- Bottom row: "accuracy" (scale: 0.7–1.3)
- **Legend** (right-aligned):
- SD: Orange dotted line
- SpecTr: Red dashed line
- RSD-C: Green solid line
- RSD-S: Blue solid line
- **Panels**: Organized by model (rows) and dataset (columns), with labels like "Llama 2-7B", "XSum", etc.
### Detailed Analysis
#### Block Efficiency (Top Row)
- **Trend**: All lines show upward trends as token count increases. RSD-S (blue) and RSD-C (green) consistently outperform SD (orange) and SpecTr (red).
- **Values**:
- Llama 2-7B (SD): 1.8 → 2.2
- Llama 2-7B (RSD-S): 1.8 → 2.2
- XSum (RSD-C): 2.4 → 2.6
#### Token Rate (Middle Row)
- **Trend**: All lines decline as token count increases. RSD-S (blue) and RSD-C (green) maintain higher values than SD (orange) and SpecTr (red).
- **Values**:
- Llama 2-7B (SD): 0.9 → 0.6
- Llama 2-7B (RSD-S): 0.9 → 0.6
- Dolly (SpecTr): 1.0 → 0.4
#### Accuracy (Bottom Row)
- **Trend**: All lines remain flat across token counts, with minor fluctuations. RSD-S (blue) and RSD-C (green) show slight improvements.
- **Values**:
- Llama 2-7B (SD): 1.0 → 1.0
- Llama 2-7B (RSD-S): 1.0 → 1.0
- XSum (RSD-C): 1.0 → 1.0
### Key Observations
1. **RSD-S and RSD-C Dominance**: These datasets consistently achieve higher block efficiency and token rate across all models.
2. **Token Count Impact**: Block efficiency improves with more tokens, while token rate declines, suggesting a trade-off between efficiency and computational cost.
3. **Accuracy Stability**: Accuracy remains near 1.0 for all models/datasets, indicating robustness to token count changes.
### Interpretation
The data demonstrates that RSD-C and RSD-S datasets optimize resource utilization (higher block efficiency, lower token rate) compared to SD and SpecTr. The consistent accuracy across token counts suggests these models maintain reliability regardless of input size. The inverse relationship between block efficiency and token rate highlights a potential design trade-off: models that process more tokens per unit time (higher block efficiency) may require more computational resources per token (lower token rate). This could inform decisions about model selection based on application priorities (e.g., speed vs. resource efficiency).