## Diagram: Automated Code Patch Extraction and Verification Pipeline
### Overview
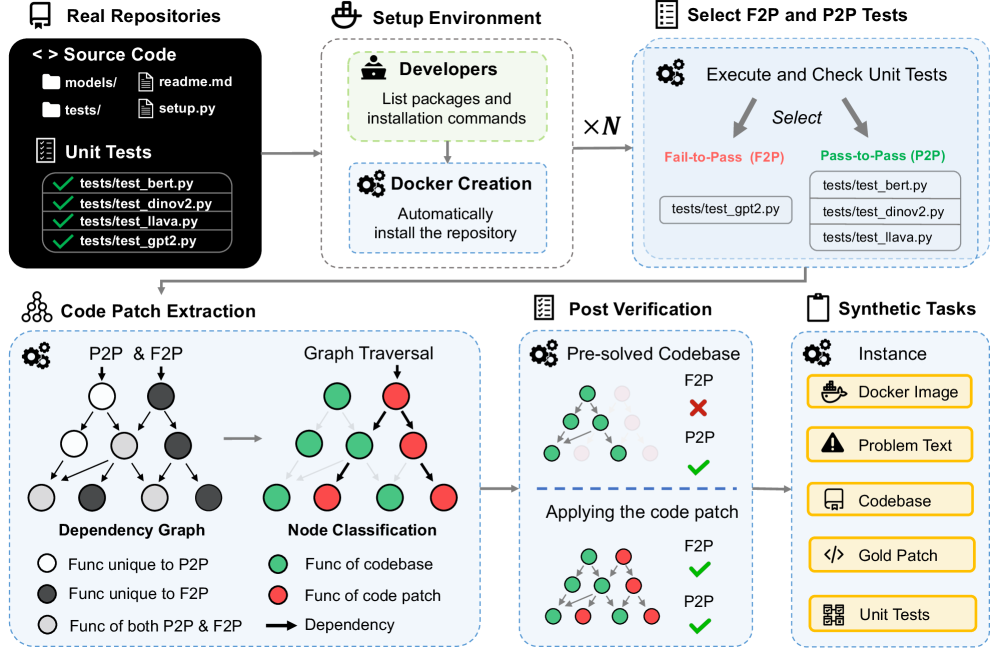
The image is a technical flowchart illustrating a multi-stage pipeline for automatically extracting, classifying, and verifying code patches from real software repositories. The process involves setting up isolated environments, selecting specific types of unit tests (Fail-to-Pass and Pass-to-Pass), extracting code patches via dependency graph analysis, and verifying their correctness. The final output is a set of "Synthetic Tasks" for benchmarking or further analysis.
### Components/Axes
The diagram is organized into six major, sequentially connected stages, flowing generally from left to right and top to bottom.
1. **Real Repositories (Top-Left):**
* **Source Code:** Represented by a folder icon. Lists subdirectories and files: `models/`, `tests/`, `readme.md`, `setup.py`.
* **Unit Tests:** Represented by a checklist icon. Lists specific test files with green checkmarks: `tests/test_bert.py`, `tests/test_dinov2.py`, `tests/test_llava.py`, `tests/test_gpt2.py`.
2. **Setup Environment (Top-Center):**
* **Developers:** Icon of a person. Action: "List packages and installation commands".
* **Docker Creation:** Icon of gears. Action: "Automatically install the repository".
* An arrow points from "Real Repositories" to this stage.
3. **Select F2P and P2P Tests (Top-Right):**
* **Execute and Check Unit Tests:** Icon of gears. Two arrows labeled "Select" point to two categories:
* **Fail-to-Pass (F2P):** Text in red. Lists `tests/test_gpt2.py`.
* **Pass-to-Pass (P2P):** Text in green. Lists `tests/test_dinov2.py`, `tests/test_llava.py`, `tests/test_bert.py`.
* A label "× N" indicates this process is repeated N times.
4. **Code Patch Extraction (Bottom-Left):**
* **Dependency Graph:** A graph with nodes (circles) and directed edges (arrows). A legend defines node colors:
* White circle: "Func unique to P2P"
* Dark gray circle: "Func unique to F2P"
* Light gray circle: "Func of both P2P & F2P"
* **Graph Traversal & Node Classification:** The dependency graph is processed. A second graph shows nodes re-colored based on classification:
* Green circle: "Func of codebase"
* Red circle: "Func of code patch"
* Black arrow: "Dependency"
* The process is labeled "P2P & F2P" at the input.
5. **Post Verification (Bottom-Center):**
* **Pre-solved Codebase:** Shows a graph with green (codebase) and red (patch) nodes. Status indicators:
* F2P: Red X (fails)
* P2P: Green checkmark (passes)
* **Applying the code patch:** Shows the same graph after patch application. Status indicators:
* F2P: Green checkmark (now passes)
* P2P: Green checkmark (still passes)
* This visually demonstrates the patch successfully fixing the F2P test without breaking the P2P tests.
6. **Synthetic Tasks (Bottom-Right):**
* **Instance:** The final output package, represented by a clipboard icon. Contains:
* Docker Image (container icon)
* Problem Text (warning triangle icon)
* Codebase (computer screen icon)
* Gold Patch (code brackets icon)
* Unit Tests (checklist icon)
### Detailed Analysis
The pipeline's flow is as follows:
1. **Input:** A real repository containing source code and unit tests.
2. **Environment Setup:** The repository's dependencies are identified and used to create a reproducible Docker container.
3. **Test Selection:** Unit tests are executed and categorized. Tests that fail initially but pass after a patch (F2P) are separated from tests that pass both before and after (P2P). The example shows `test_gpt2.py` as F2P, while `test_bert.py`, `test_dinov2.py`, and `test_llava.py` are P2P.
4. **Patch Extraction:** A dependency graph is built from the code involved in the selected tests. Nodes (functions) are classified as unique to P2P tests, unique to F2P tests, or common to both. Through graph traversal, functions are ultimately classified as either part of the original "codebase" (green) or part of the "code patch" (red) needed to fix the F2P test.
5. **Verification:** The extracted patch is applied to the pre-solved codebase. The diagram confirms the patch's correctness: the F2P test now passes (green check), and all P2P tests remain passing (green check).
6. **Output:** The result is a "Synthetic Task" instance, a self-contained package including the Docker environment, a description of the problem ("Problem Text"), the codebase, the correct patch ("Gold Patch"), and the relevant unit tests.
### Key Observations
* The process is designed to isolate the minimal code change (the "patch") that fixes a specific failing test while preserving the functionality verified by other passing tests.
* The use of dependency graphs and node classification is central to distinguishing patch code from existing codebase code.
* The "Post Verification" stage acts as a crucial quality check, ensuring the patch is both effective (fixes F2P) and safe (doesn't break P2P).
* The final "Synthetic Tasks" output is structured as a benchmark or dataset instance, likely for training or evaluating automated program repair or code understanding models.
### Interpretation
This diagram outlines a sophisticated, automated methodology for creating high-quality datasets of software bugs and their fixes. By starting from real repositories and using unit tests as oracles, it grounds the data in practical software engineering contexts. The key innovation is the systematic extraction and verification of the *minimal relevant patch* through dependency analysis, rather than just storing entire file changes. This process likely yields "Synthetic Tasks" that are more precise and useful for research in areas like automated debugging, program repair, and code generation, as each task clearly defines a problem (a failing test), a context (the codebase), and a verified solution (the gold patch). The pipeline emphasizes reproducibility (via Docker), precision (via graph-based patch extraction), and correctness (via post-verification).