## Scatter Plot: Timing Analysis of Guesses
### Overview
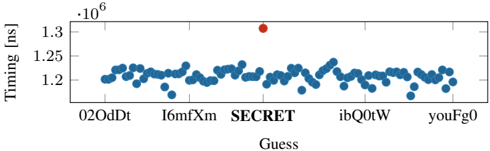
The image is a scatter plot comparing timing measurements (in nanoseconds) across different "Guess" categories. The y-axis represents timing values scaled by 1e6 (ns), while the x-axis lists categorical labels. A single red outlier ("SECRET") stands out against a cluster of blue data points.
### Components/Axes
- **Y-Axis**: "Timing [ns]" with a scale from 1.2e6 to 1.3e6 (increments of 0.05e6).
- **X-Axis**: Categorical labels: `02OdDt`, `I6mfXm`, `SECRET`, `ibQ0tW`, `youFg0`.
- **Data Points**:
- Blue dots (majority) clustered around 1.2e6 ns.
- Red dot ("SECRET") at 1.3e6 ns, positioned centrally on the x-axis.
### Detailed Analysis
- **Timing Distribution**:
- Blue data points show minor fluctuations between 1.2e6 and 1.25e6 ns, with no clear upward/downward trend.
- The red "SECRET" point is distinctly higher at 1.3e6 ns, deviating by ~100,000 ns from the cluster.
- **Positioning**:
- "SECRET" is centered on the x-axis, flanked by `I6mfXm` (left) and `ibQ0tW` (right).
- Blue points are evenly distributed across all x-axis categories except "SECRET".
### Key Observations
1. **Outlier Identification**: "SECRET" is the sole outlier, with timing 100,000 ns higher than the cluster.
2. **Consistency**: Blue data points exhibit minimal variation (~50,000 ns range), suggesting stable measurements for non-SECRET guesses.
3. **Label Clarity**: All x-axis labels are legible, with "SECRET" emphasized in bold.
### Interpretation
The data suggests that "SECRET" represents a distinct process or measurement with significantly higher timing compared to other guesses. This could indicate:
- A computational bottleneck or inefficiency unique to "SECRET".
- A deliberate design choice for "SECRET" to prioritize accuracy over speed.
- An anomaly in data collection for "SECRET" (e.g., measurement error).
The clustering of blue points implies that most guesses perform similarly, but "SECRET" stands out as a critical case requiring further investigation. The absence of a legend is mitigated by explicit labeling of the red outlier.