\n
## Scatter Plot: Timing vs. Guess
### Overview
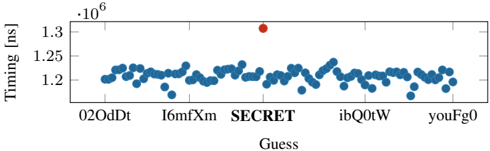
This image presents a scatter plot visualizing the relationship between "Guess" values on the x-axis and "Timing" in nanoseconds (ns) on the y-axis. The plot displays a series of data points, with one outlier significantly deviating from the general trend.
### Components/Axes
* **X-axis:** Labeled "Guess". The categories displayed are: "02OdDt", "l6mfXm", "SECRET", "ibQ0tW", and "youFg0".
* **Y-axis:** Labeled "Timing [ns]". The scale ranges from approximately 1.20 x 10<sup>6</sup> ns to 1.30 x 10<sup>6</sup> ns.
* **Data Points:** Represented by blue circles.
* **Outlier:** A single red circle, visually distinct from the blue data points.
### Detailed Analysis
The majority of the data points cluster between approximately 1.21 x 10<sup>6</sup> ns and 1.27 x 10<sup>6</sup> ns. The data appears somewhat scattered, with no strong linear trend visible across the majority of the points.
Let's analyze the data points for each "Guess" category:
* **02OdDt:** Timing values range from approximately 1.21 x 10<sup>6</sup> ns to 1.26 x 10<sup>6</sup> ns.
* **l6mfXm:** Timing values range from approximately 1.19 x 10<sup>6</sup> ns to 1.25 x 10<sup>6</sup> ns.
* **SECRET:** This category contains the outlier. The timing value is approximately 1.31 x 10<sup>6</sup> ns.
* **ibQ0tW:** Timing values range from approximately 1.22 x 10<sup>6</sup> ns to 1.27 x 10<sup>6</sup> ns.
* **youFg0:** Timing values range from approximately 1.21 x 10<sup>6</sup> ns to 1.26 x 10<sup>6</sup> ns.
The outlier, associated with the "SECRET" guess, is significantly higher in timing than all other data points.
### Key Observations
* The "SECRET" guess exhibits a substantially longer timing compared to all other guesses. This is a clear outlier.
* The timing values for the other guesses ("02OdDt", "l6mfXm", "ibQ0tW", "youFg0") are relatively consistent, with some variation within each category.
* There is no obvious correlation between the "Guess" category and the timing value, except for the outlier.
### Interpretation
The data suggests that the process being measured (timing) is generally consistent across different "Guess" values. However, the "SECRET" guess triggers a significantly longer timing, indicating a potential difference in the underlying process or a specific characteristic associated with that guess. This could be due to a more complex computation, a different code path, or some other factor that increases the execution time.
The outlier is a critical observation. It suggests that the "SECRET" guess is somehow special or requires a different handling mechanism, leading to the increased timing. Further investigation is needed to understand why this occurs. The data could be related to a side-channel attack or a security vulnerability where the timing reveals information about the secret. The fact that the timing is so much higher for "SECRET" is a strong indicator of something unusual happening during the processing of that guess.