## Chart/Diagram Type: Comparative Analysis of Reasoning Methods
### Overview
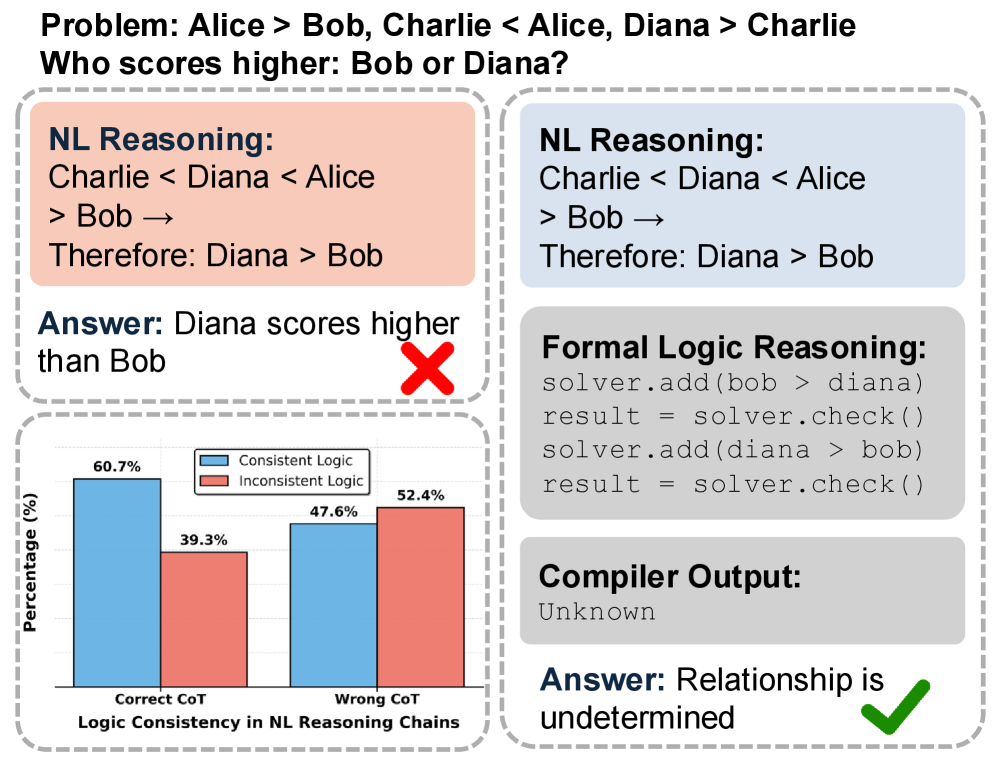
The image presents a comparative analysis of Natural Language (NL) reasoning versus Formal Logic reasoning in solving a problem involving relative scoring. It includes a problem statement, NL reasoning steps, formal logic reasoning steps, compiler output, and a bar chart comparing the consistency of logic in NL reasoning chains.
### Components/Axes
* **Problem Statement:** "Alice > Bob, Charlie < Alice, Diana > Charlie. Who scores higher: Bob or Diana?"
* **NL Reasoning (Left):**
* Steps: "Charlie < Diana < Alice > Bob → Therefore: Diana > Bob"
* Answer: "Diana scores higher than Bob" (marked with a red "X")
* **NL Reasoning (Right):**
* Steps: "Charlie < Diana < Alice > Bob → Therefore: Diana > Bob"
* **Formal Logic Reasoning:**
* Code:
* "solver.add(bob > diana)"
* "result = solver.check()"
* "solver.add(diana > bob)"
* "result = solver.check()"
* **Compiler Output:** "Unknown"
* **Final Answer (Formal Logic):** "Relationship is undetermined" (marked with a green checkmark)
* **Bar Chart:**
* X-axis: "Logic Consistency in NL Reasoning Chains" with categories "Correct CoT" and "Wrong CoT"
* Y-axis: "Percentage (%)"
* Legend (top-center):
* Blue: "Consistent Logic"
* Red: "Inconsistent Logic"
### Detailed Analysis
**Bar Chart Data:**
* **Correct CoT (Correct Chain of Thought):**
* Consistent Logic (Blue): 60.7%
* Inconsistent Logic (Red): 39.3%
* **Wrong CoT (Wrong Chain of Thought):**
* Consistent Logic (Blue): 47.6%
* Inconsistent Logic (Red): 52.4%
**Trend Verification:**
* For "Correct CoT", the "Consistent Logic" bar is significantly higher than the "Inconsistent Logic" bar.
* For "Wrong CoT", the "Inconsistent Logic" bar is slightly higher than the "Consistent Logic" bar.
### Key Observations
* NL reasoning, while providing a seemingly logical answer, is marked as incorrect.
* Formal logic reasoning, through code, determines that the relationship between Bob and Diana cannot be determined.
* The bar chart shows that even with a "Correct CoT", there's still a significant percentage (39.3%) of inconsistent logic in NL reasoning.
* When the "CoT" is wrong, the "Inconsistent Logic" is slightly higher than the "Consistent Logic".
### Interpretation
The image highlights the potential pitfalls of relying solely on NL reasoning for problem-solving, especially when dealing with logical relationships. While NL reasoning can provide an intuitive answer, it may not always be logically consistent or accurate. Formal logic, on the other hand, provides a more rigorous approach, capable of identifying when a relationship cannot be definitively determined. The bar chart emphasizes that inconsistencies can arise even when the chain of thought appears correct, suggesting that NL reasoning is prone to errors. The comparison underscores the importance of using formal methods to verify the correctness of NL-based solutions, especially in critical applications.