## Current vs. Time Graph with Varying Voltage and Current Conditions
### Overview
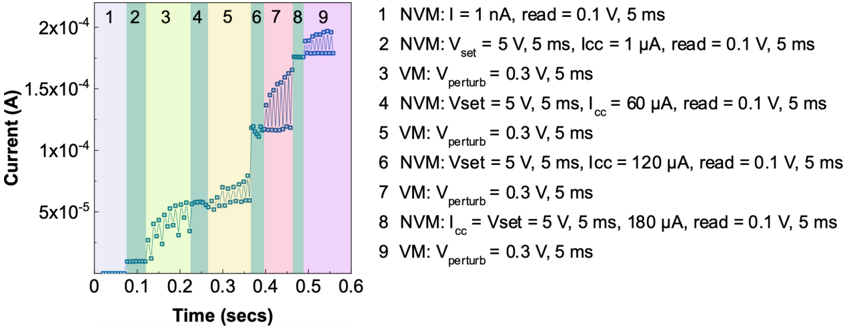
The image is a line graph showing the current (in Amperes) as a function of time (in seconds). The graph illustrates how the current changes over time under different voltage and current conditions, which are indicated by numbered, colored vertical bands. The conditions alternate between applying a "perturb" voltage (VM) and setting the voltage with varying current limits (NVM).
### Components/Axes
* **Y-axis:** Current (A), with a scale from 0 to 2x10^-4 A. Major tick marks are at 0, 5x10^-5, 1x10^-4, 1.5x10^-4, and 2x10^-4 A.
* **X-axis:** Time (secs), with a scale from 0 to 0.6 seconds. Major tick marks are at 0, 0.1, 0.2, 0.3, 0.4, 0.5, and 0.6 seconds.
* **Data Series:** A single data series represented by a blue line with square markers, showing the current's evolution over time.
* **Vertical Bands:** Nine vertical bands, each with a different background color, numbered 1 through 9. Each band corresponds to a specific voltage/current condition described in the legend to the right of the graph.
* **Legend (Right Side):** A numbered list describing the voltage and current conditions for each vertical band.
1. NVM: I = 1 nA, read = 0.1 V, 5 ms
2. NVM: Vset = 5 V, 5 ms, Icc = 1 µA, read = 0.1 V, 5 ms
3. VM: Vperturb = 0.3 V, 5 ms
4. NVM: Vset = 5 V, 5 ms, Icc = 60 µA, read = 0.1 V, 5 ms
5. VM: Vperturb = 0.3 V, 5 ms
6. NVM: Vset = 5 V, 5 ms, Icc = 120 µA, read = 0.1 V, 5 ms
7. VM: Vperturb = 0.3 V, 5 ms
8. NVM: Icc = Vset = 5 V, 5 ms, 180 µA, read = 0.1 V, 5 ms
9. VM: Vperturb = 0.3 V, 5 ms
### Detailed Analysis
* **Band 1 (Blue):** NVM, I = 1 nA. The current is approximately 0 A.
* **Band 2 (Green):** NVM, Vset = 5 V, Icc = 1 µA. The current increases to approximately 2x10^-5 A.
* **Band 3 (Yellow):** VM, Vperturb = 0.3 V. The current remains around 2x10^-5 A, with some fluctuations.
* **Band 4 (Green):** NVM, Vset = 5 V, Icc = 60 µA. The current increases to approximately 6x10^-5 A.
* **Band 5 (Yellow):** VM, Vperturb = 0.3 V. The current remains around 6x10^-5 A, with some fluctuations.
* **Band 6 (Green):** NVM, Vset = 5 V, Icc = 120 µA. The current increases to approximately 1.2x10^-4 A.
* **Band 7 (Yellow):** VM, Vperturb = 0.3 V. The current remains around 1.2x10^-4 A, with some fluctuations.
* **Band 8 (Pink):** NVM, Icc = Vset = 5 V, 180 µA. The current increases to approximately 1.8x10^-4 A.
* **Band 9 (Purple):** VM, Vperturb = 0.3 V. The current remains around 1.8x10^-4 A, with some fluctuations.
### Key Observations
* The current increases significantly when the voltage is set (Vset) with increasing current limits (Icc).
* The current remains relatively stable, with minor fluctuations, when the perturb voltage (Vperturb) is applied.
* The current levels off at different plateaus corresponding to the different Icc values.
### Interpretation
The graph demonstrates the effect of applying different voltage and current conditions to a non-volatile memory (NVM) device. Setting the voltage (Vset) with increasing current limits (Icc) causes the current to increase in a stepwise manner, indicating a change in the device's resistance. Applying a perturb voltage (Vperturb) does not significantly alter the current, suggesting that it does not cause a significant change in the device's state. The data suggests that the NVM device's resistance can be controlled by varying the Vset and Icc parameters. The plateaus observed during the Vperturb phases indicate that the device maintains its state until a new Vset is applied.