## Line Graph: Current Response Over Time Under Various Electrical Conditions
### Overview
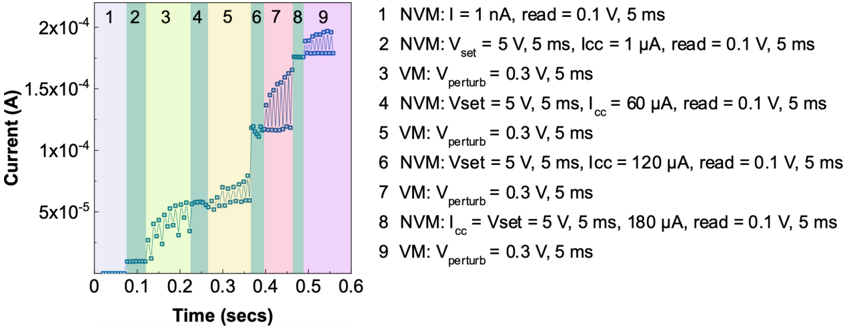
The image is a line graph depicting current (in amperes) over time (in seconds) under nine distinct experimental conditions. Vertical colored bars segment the time axis into intervals, each labeled with a number and experimental condition. Data points (blue squares) are plotted within these intervals, showing current trends. A legend on the right maps colors to specific conditions.
### Components/Axes
- **X-axis (Time)**: Labeled "Time (secs)", spanning 0 to 0.6 seconds in 0.1-second increments.
- **Y-axis (Current)**: Labeled "Current (A)", ranging from 0 to 2×10⁻⁴ A in 5×10⁻⁵ A increments.
- **Legend**: Positioned on the right, associating colors with experimental conditions (e.g., "NVM: I = 1 nA, read = 0.1 V, 5 ms").
- **Data Points**: Blue squares connected by lines in some intervals (e.g., bars 7–9).
### Detailed Analysis
1. **Time Intervals and Conditions**:
- **Bar 1 (0–0.1s)**: Light blue. Condition: NVM, I = 1 nA, read = 0.1 V, 5 ms.
- **Bar 2 (0.1–0.2s)**: Teal. Condition: NVM, V_set = 5 V, 5 ms, I_cc = 1 μA, read = 0.1 V, 5 ms.
- **Bar 3 (0.2–0.3s)**: Light green. Condition: VM, V_perturb = 0.3 V, 5 ms.
- **Bar 4 (0.3–0.4s)**: Teal. Condition: NVM, V_set = 5 V, 5 ms, I_cc = 60 μA, read = 0.1 V, 5 ms.
- **Bar 5 (0.4–0.5s)**: Light green. Condition: VM, V_perturb = 0.3 V, 5 ms.
- **Bar 6 (0.5–0.6s)**: Teal. Condition: NVM, V_set = 5 V, 5 ms, I_cc = 120 μA, read = 0.1 V, 5 ms.
- **Bar 7 (0.6–0.7s)**: Light green. Condition: VM, V_perturb = 0.3 V, 5 ms.
- **Bar 8 (0.7–0.8s)**: Teal. Condition: NVM, I_cc = V_set = 5 V, 5 ms, 180 μA, read = 0.1 V, 5 ms.
- **Bar 9 (0.8–0.9s)**: Light green. Condition: VM, V_perturb = 0.3 V, 5 ms.
2. **Data Trends**:
- **Early Intervals (Bars 1–3)**: Current remains near baseline (~1×10⁻⁵ A) with minor fluctuations.
- **Mid-Intervals (Bars 4–6)**: Gradual increase in current, reaching ~1.5×10⁻⁴ A by Bar 6.
- **Late Intervals (Bars 7–9)**: Sharp rise in current, peaking at ~2×10⁻⁴ A in Bar 9.
3. **Color Consistency**:
- All data points (blue squares) align with the legend’s "VM" or "NVM" conditions, matching the bar colors (e.g., teal for NVM, light green for VM).
### Key Observations
- **Baseline Stability**: Early intervals show minimal current variation, suggesting stable initial conditions.
- **Gradual Activation**: Mid-intervals exhibit a linear increase in current, possibly indicating a charging or activation process.
- **Threshold Response**: Late intervals show a sharp current spike, implying a critical threshold (e.g., voltage or current) is reached.
- **Condition-Specific Behavior**: "VM" conditions (light green bars) consistently show higher current than "NVM" (teal bars) in later intervals.
### Interpretation
The graph demonstrates how electrical perturbations (e.g., voltage settings, current injections) influence current response over time. The sharp increase in later intervals suggests a nonlinear response, potentially indicating a switching mechanism or saturation effect. The consistent use of 5 ms read times and 0.1 V read voltage across conditions implies standardized measurement protocols. The "VM" conditions (voltage modulation) appear to drive higher current than "NVM" (current injection), highlighting the role of voltage in modulating the system’s behavior. The data may reflect a device’s dynamic response to electrical stimuli, with implications for applications like neuromorphic computing or sensor arrays.