## Scatter Plot: Projection of Activations on τG and τP
### Overview
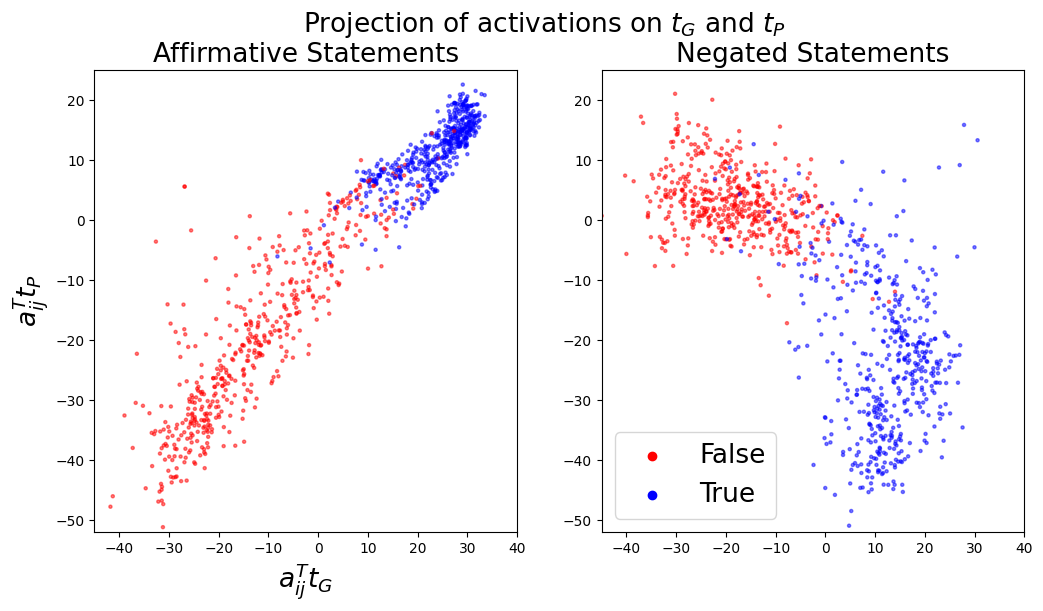
The image presents two scatter plots side-by-side. Both plots visualize the projection of activations onto two axes, denoted as τG and τP. The left plot displays data for "Affirmative Statements," while the right plot shows data for "Negated Statements." Each point in the scatter plots represents a data instance, colored to indicate whether it is classified as "True" or "False."
### Components/Axes
* **Title:** "Projection of activations on τG and τP" (centered at the top)
* **Subtitles:** "Affirmative Statements" (left plot), "Negated Statements" (right plot)
* **X-axis Label (both plots):** a<sub>ij</sub><sup>T</sup>τ<sub>G</sub> (ranging approximately from -40 to 40)
* **Y-axis Label (both plots):** a<sub>ij</sub><sup>T</sup>τ<sub>P</sub> (ranging approximately from -50 to 20)
* **Legend (bottom-right of the right plot):**
* Red circle: False
* Blue circle: True
### Detailed Analysis or Content Details
**Left Plot: Affirmative Statements**
* **Trend:** The data points exhibit a strong positive linear correlation. As a<sub>ij</sub><sup>T</sup>τ<sub>G</sub> increases, a<sub>ij</sub><sup>T</sup>τ<sub>P</sub> also tends to increase.
* **False (Red):** Points are clustered in the lower-left quadrant, with a<sub>ij</sub><sup>T</sup>τ<sub>G</sub> ranging from approximately -40 to -10 and a<sub>ij</sub><sup>T</sup>τ<sub>P</sub> ranging from approximately -50 to 0. There is some spread, but the majority of points fall within this region.
* **True (Blue):** Points are concentrated along a diagonal line extending from the top-left to the bottom-right, with a<sub>ij</sub><sup>T</sup>τ<sub>G</sub> ranging from approximately -20 to 30 and a<sub>ij</sub><sup>T</sup>τ<sub>P</sub> ranging from approximately -20 to 20. The points are more densely packed along this line.
**Right Plot: Negated Statements**
* **Trend:** The data points show a less pronounced positive correlation compared to the left plot. There is more scatter and a wider distribution of points.
* **False (Red):** Points are scattered across the plot, with a higher concentration in the lower-right quadrant. a<sub>ij</sub><sup>T</sup>τ<sub>G</sub> ranges from approximately -40 to 30, and a<sub>ij</sub><sup>T</sup>τ<sub>P</sub> ranges from approximately -40 to 10.
* **True (Blue):** Points are also scattered, but with a tendency to cluster in the upper-right quadrant. a<sub>ij</sub><sup>T</sup>τ<sub>G</sub> ranges from approximately -20 to 40, and a<sub>ij</sub><sup>T</sup>τ<sub>P</sub> ranges from approximately -10 to 20.
### Key Observations
* The distinction between "True" and "False" is much clearer in the "Affirmative Statements" plot than in the "Negated Statements" plot.
* The positive correlation in the "Affirmative Statements" plot suggests that high values of τG and τP are associated with "True" statements, while low values are associated with "False" statements.
* The scatter in the "Negated Statements" plot indicates that the relationship between τG, τP, and truth value is more complex for negated statements.
* There are no obvious outliers in either plot.
### Interpretation
The plots demonstrate how activations are projected onto two specific vectors (τG and τP) to differentiate between true and false statements. The strong correlation observed in the "Affirmative Statements" plot suggests that these vectors effectively capture the semantic information necessary to identify true affirmative statements. The weaker correlation in the "Negated Statements" plot implies that negation introduces complexity, potentially requiring additional features or a different representation to accurately classify negated statements.
The axes τG and τP likely represent some learned features or dimensions in the activation space that are relevant to truth assessment. The projection onto these axes allows for a visualization of how statements are positioned in this space, and how this positioning relates to their truth value. The difference in the patterns between affirmative and negated statements suggests that negation alters the activation patterns in a way that makes it harder to separate true and false statements using these two dimensions alone. This could be due to the need to represent both the original statement and its negation simultaneously, or to the fact that negation introduces a layer of abstraction that is not fully captured by τG and τP.