## Scatter Plots: Projection of activations on t_G and t_P
### Overview
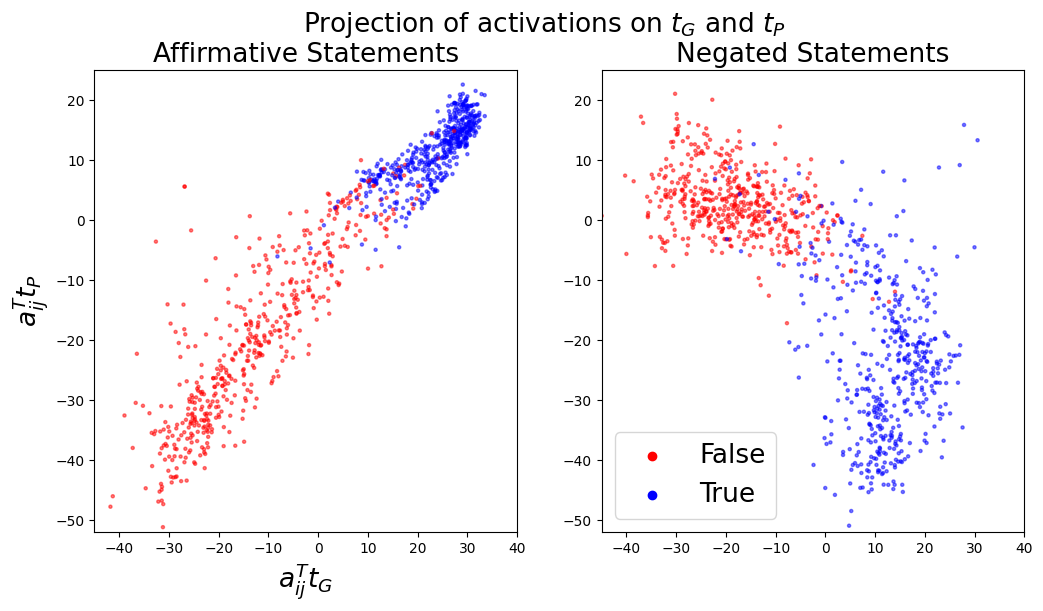
Two scatter plots compare activation projections for affirmative and negated statements. Each plot uses red (False) and blue (True) markers to distinguish truth values. The left plot shows affirmative statements, while the right shows negated statements. Both axes represent transformed activation values (a^T_ij t_G and a^T_ij t_P).
### Components/Axes
- **X-axis (both plots)**: `a^T_ij t_G` (range: -40 to 40)
- **Y-axis (both plots)**: `a^T_ij t_P` (range: -50 to 20)
- **Legend**: Located at bottom-right of each plot
- Red: False
- Blue: True
- **Plot Titles**:
- Left: "Affirmative Statements"
- Right: "Negated Statements"
### Detailed Analysis
#### Affirmative Statements (Left Plot)
- **False (Red)**: Clustered in lower-left quadrant (x: -40 to 0, y: -50 to -10)
- **True (Blue)**: Concentrated in upper-right quadrant (x: 0 to 40, y: 0 to 20)
- **Trend**: Positive correlation between `a^T_ij t_G` and `a^T_ij t_P` for True statements. False statements show minimal correlation.
#### Negated Statements (Right Plot)
- **False (Red)**: Scattered across upper-left quadrant (x: -40 to 0, y: -10 to 20)
- **True (Blue)**: Clustered in lower-right quadrant (x: 0 to 40, y: -50 to 0)
- **Trend**: Negative correlation between `a^T_ij t_G` and `a^T_ij t_P` for True statements. False statements show no clear pattern.
### Key Observations
1. **Affirmative Statements**:
- True statements consistently show higher values for both `a^T_ij t_G` and `a^T_ij t_P`.
- False statements cluster in regions of low activation for both axes.
2. **Negated Statements**:
- True statements exhibit higher `a^T_ij t_G` but lower `a^T_ij t_P` compared to False statements.
- False statements are more dispersed, with some outliers in the upper-right quadrant.
3. **Divergence in Patterns**:
- Affirmative True/False clusters are spatially distinct.
- Negated True/False clusters overlap more but maintain directional separation.
### Interpretation
The data suggests that:
- **Affirmative Statements**: The model's activations for True statements align strongly with both `t_G` and `t_P`, while False statements lack this alignment.
- **Negated Statements**: True statements show a trade-off between `t_G` and `t_P` activations, whereas False statements lack consistent patterns.
- **Implications**: The separation in activation projections may reflect how the model processes truth values differently based on statement polarity (affirmative vs. negated). The negated statements' dispersed False cluster could indicate ambiguity or contextual variability in negation handling.
No textual content in other languages was detected. All axis labels, legends, and plot titles were transcribed directly from the image.