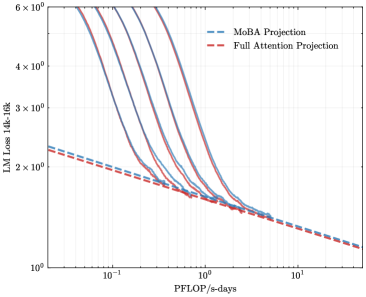
## Chart/Diagram Type: Line Chart
### Overview
The image is a line chart comparing the performance of "MoBA Projection" and "Full Attention Projection" models. The chart plots "LM Loss 14k-16k" against "PFLOP/s-days" on a log-log scale. Several lines are shown for each model type, indicating different runs or configurations.
### Components/Axes
* **X-axis:** PFLOP/s-days (log scale), with markers at 10<sup>-1</sup>, 10<sup>0</sup> (1), and 10<sup>1</sup> (10).
* **Y-axis:** LM Loss 14k-16k (log scale), with markers at 2 x 10<sup>0</sup> (2), 3 x 10<sup>0</sup> (3), 4 x 10<sup>0</sup> (4), and 6 x 10<sup>0</sup> (6).
* **Legend:** Located at the top-right of the chart.
* "MoBA Projection" is represented by a dashed blue line.
* "Full Attention Projection" is represented by a dashed red line.
### Detailed Analysis or ### Content Details
* **MoBA Projection (dashed blue lines):**
* The four MoBA Projection lines start at different LM Loss values between approximately 4 x 10<sup>0</sup> and 6 x 10<sup>0</sup> at low PFLOP/s-days values (around 0.05).
* All four lines show a decreasing trend in LM Loss as PFLOP/s-days increases.
* The lines converge around PFLOP/s-days = 1, with LM Loss values around 1.5 x 10<sup>0</sup>.
* Beyond PFLOP/s-days = 1, the lines continue to decrease gradually.
* **Full Attention Projection (dashed red line):**
* The Full Attention Projection line starts at an LM Loss of approximately 2.3 x 10<sup>0</sup> at low PFLOP/s-days values (around 0.05).
* The line shows a decreasing trend in LM Loss as PFLOP/s-days increases.
* The line reaches an LM Loss of approximately 1.3 x 10<sup>0</sup> at PFLOP/s-days = 10.
### Key Observations
* The MoBA Projection models initially have a higher LM Loss than the Full Attention Projection model.
* As PFLOP/s-days increases, the LM Loss for both models decreases.
* The MoBA Projection models converge to a similar LM Loss as the Full Attention Projection model around PFLOP/s-days = 1.
* At higher PFLOP/s-days values, the Full Attention Projection model appears to have a slightly lower LM Loss than the MoBA Projection models.
### Interpretation
The chart compares the performance of two different projection methods ("MoBA Projection" and "Full Attention Projection") in terms of language modeling loss (LM Loss) as a function of computational resources (PFLOP/s-days). The data suggests that while MoBA Projection models may initially have a higher loss, they converge to a similar performance level as Full Attention Projection models with increased computational resources. The Full Attention Projection model seems to achieve a slightly lower loss at higher computational costs. The multiple lines for MoBA Projection likely represent different initialization or hyperparameter settings, showing the variability in performance for that model type.