## Chart: LM Loss vs. PFLOP/s-days
### Overview
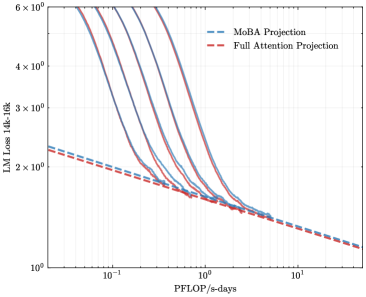
This chart displays the relationship between LM Loss (Language Model Loss) and PFLOP/s-days (Floating Point Operations Per Second per day) for two different projection methods: MoBA Projection and Full Attention Projection. The chart uses a logarithmic scale for both axes. Multiple lines are present for each projection method, representing different runs or trials.
### Components/Axes
* **X-axis:** PFLOP/s-days, ranging from approximately 10<sup>-2</sup> to 10<sup>1</sup> (logarithmic scale).
* **Y-axis:** LM Loss 14k-16k, ranging from approximately 10<sup>0</sup> to 6 x 10<sup>6</sup> (logarithmic scale).
* **Legend:** Located in the top-right corner.
* MoBA Projection (Blue dashed line)
* Full Attention Projection (Red dashed line)
* Multiple lines are plotted for each projection method, showing variations in performance.
### Detailed Analysis
The chart shows several lines for each projection method. Let's analyze each:
**MoBA Projection (Blue dashed line):**
* The lines generally slope downwards, indicating that as PFLOP/s-days increase, LM Loss decreases.
* There are approximately 6 lines visible for MoBA Projection.
* At PFLOP/s-days ≈ 10<sup>-2</sup>, the LM Loss ranges from approximately 2 x 10<sup>5</sup> to 5 x 10<sup>5</sup>.
* At PFLOP/s-days ≈ 10<sup>0</sup>, the LM Loss ranges from approximately 2 x 10<sup>4</sup> to 5 x 10<sup>4</sup>.
* At PFLOP/s-days ≈ 10<sup>1</sup>, the LM Loss ranges from approximately 5 x 10<sup>3</sup> to 1 x 10<sup>4</sup>.
**Full Attention Projection (Red dashed line):**
* Similar to MoBA Projection, the lines slope downwards, showing a decrease in LM Loss with increasing PFLOP/s-days.
* There are approximately 6 lines visible for Full Attention Projection.
* At PFLOP/s-days ≈ 10<sup>-2</sup>, the LM Loss ranges from approximately 3 x 10<sup>5</sup> to 6 x 10<sup>5</sup>.
* At PFLOP/s-days ≈ 10<sup>0</sup>, the LM Loss ranges from approximately 1 x 10<sup>4</sup> to 3 x 10<sup>4</sup>.
* At PFLOP/s-days ≈ 10<sup>1</sup>, the LM Loss ranges from approximately 2 x 10<sup>3</sup> to 5 x 10<sup>3</sup>.
The lines for Full Attention Projection generally appear to be below the lines for MoBA Projection, suggesting that Full Attention Projection achieves lower LM Loss for a given PFLOP/s-days value.
### Key Observations
* Both projection methods demonstrate a clear trade-off between computational cost (PFLOP/s-days) and model performance (LM Loss).
* Full Attention Projection consistently outperforms MoBA Projection across the range of PFLOP/s-days values.
* There is variability in performance within each projection method, as indicated by the multiple lines. This could be due to random initialization, data variations, or other factors.
* The rate of decrease in LM Loss appears to slow down as PFLOP/s-days increases, suggesting diminishing returns.
### Interpretation
The chart demonstrates the scaling behavior of two different projection methods for a language model. The results suggest that Full Attention Projection is more efficient than MoBA Projection in terms of achieving lower LM Loss for a given computational budget. The diminishing returns observed at higher PFLOP/s-days values indicate that there is a point beyond which increasing computational resources yields only marginal improvements in model performance. The variability within each projection method highlights the importance of considering multiple runs or trials when evaluating model performance. This data is valuable for making informed decisions about resource allocation and model selection in language modeling tasks. The logarithmic scales suggest that the relationship between LM Loss and PFLOP/s-days is not linear, and that small changes in PFLOP/s-days can have a significant impact on LM Loss, especially at lower values.