\n
## Heatmaps: Projection Views
### Overview
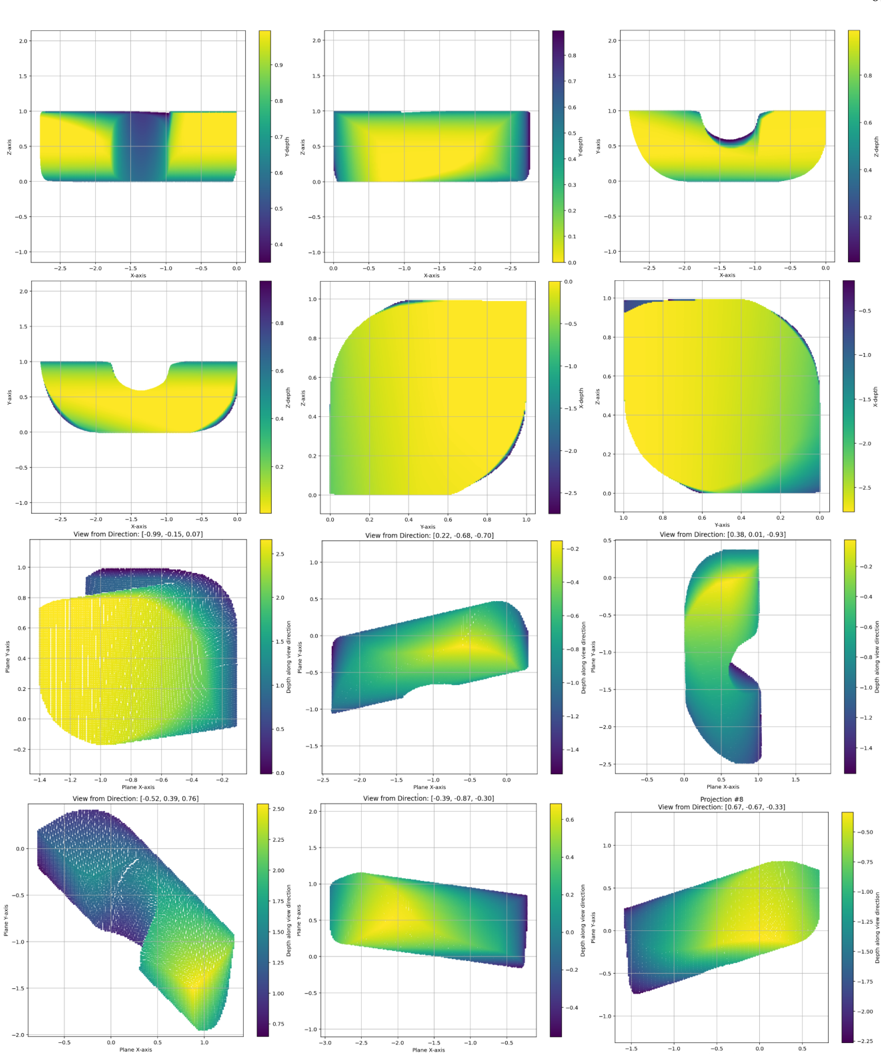
The image presents a 3x3 grid of heatmaps, each representing a projection view of a 3D object or dataset. Each heatmap displays a color gradient representing values across a 2D plane, with axes labeled "Xaxis" and "Zaxis" in most plots, and "Plane Xaxis" and "Plane Yaxis" in others. A fourth plot has axes labeled "Bearing Angle" and "Opening Angle". Each plot also has a label indicating the "View from Direction" with associated numerical values in parentheses. A final plot is labeled "Projection #5" with a "View from Direction" value.
### Components/Axes
Each heatmap shares the following components:
* **Xaxis:** Ranges approximately from -2.5 to 1.0 (varying slightly between plots).
* **Zaxis:** Ranges approximately from -1.5 to 2.0 (varying slightly between plots).
* **Plane Xaxis:** Ranges approximately from -1.5 to 1.0.
* **Plane Yaxis:** Ranges approximately from -2.5 to 2.5.
* **Bearing Angle:** Ranges approximately from -1.5 to 1.5.
* **Opening Angle:** Ranges approximately from -1.5 to 1.5.
* **Color Scale:** A gradient from approximately -0.25 (dark purple) to 0.95 (bright yellow).
* **View from Direction Label:** Located below each heatmap, indicating the viewing angle. The values are triplets of numbers, likely representing a direction vector.
* **Projection #5 Label:** Located below the final heatmap.
### Detailed Analysis or Content Details
Here's a breakdown of each heatmap, noting the general shape and approximate value ranges:
**Row 1:**
* **Plot 1 (View from Direction: [-0.99, -0.13, 0.07]):** A roughly oval shape, centered around Xaxis = -0.2, Zaxis = 0.5. Values range from approximately -0.2 to 0.8.
* **Plot 2 (View from Direction: [0.22, -0.66, 0.70]):** A crescent shape, with the open side facing right. Values range from approximately -0.2 to 0.9.
* **Plot 3 (View from Direction: [0.36, 0.01, 0.93]):** A roughly circular shape, centered around Xaxis = 0.2, Zaxis = 0.2. Values range from approximately -0.25 to 0.7.
**Row 2:**
* **Plot 4 (View from Direction: [-0.52, 0.39, 0.76]):** A curved shape resembling a "C", with the open side facing left. Values range from approximately -0.2 to 0.9.
* **Plot 5 (View from Direction: [-0.39, -0.81, 0.30]):** A roughly oval shape, centered around Xaxis = 0.0, Zaxis = 0.0. Values range from approximately -0.2 to 0.9.
* **Plot 6 (View from Direction: [0.61, -0.47, 0.33]):** A roughly circular shape, centered around Xaxis = 0.5, Zaxis = 0.0. Values range from approximately -0.25 to 0.7.
**Row 3:**
* **Plot 7 (View from Direction: [-0.87, 0.41, 0.19]):** A complex shape with a concave section on the left. Values range from approximately -0.2 to 0.9.
* **Plot 8 (View from Direction: [-0.18, -0.96, 0.20]):** A roughly oval shape, centered around Xaxis = 0.0, Zaxis = 0.0. Values range from approximately -0.2 to 0.9.
* **Plot 9 (Projection #5, View from Direction: [0.47, -0.33]):** A roughly circular shape, centered around Xaxis = 0.0, Zaxis = 0.0. Values range from approximately -0.2 to 0.9.
### Key Observations
* The color scale is consistent across all heatmaps, allowing for direct comparison of values.
* The shapes vary significantly depending on the viewing direction.
* The maximum values (bright yellow) tend to cluster in specific regions of each projection.
* The minimum values (dark purple) are generally distributed around the periphery of the shapes.
* The "View from Direction" values suggest a systematic exploration of different angles around a central object.
### Interpretation
The image likely represents different 2D projections of a 3D object or a volumetric dataset. The heatmaps visualize the distribution of some property (e.g., density, intensity, temperature) within the object. The varying shapes and value distributions in each projection indicate a non-uniform distribution of this property. The "View from Direction" values provide information about the perspective from which each projection was generated.
The systematic variation in viewing direction suggests an attempt to reconstruct the 3D structure of the object from multiple 2D projections. The consistent color scale allows for comparison of the property distribution across different views. The presence of a "Projection #5" label suggests that this is part of a larger series of projections.
The data suggests a complex, non-symmetrical object with varying internal properties. The bright yellow regions likely represent areas of high concentration or intensity, while the dark purple regions represent areas of low concentration or intensity. Further analysis of the complete set of projections would be needed to fully reconstruct the 3D structure and understand the underlying property distribution.