## Heatmap Grid: Multi-Axis Projections with Depth Visualization
### Overview
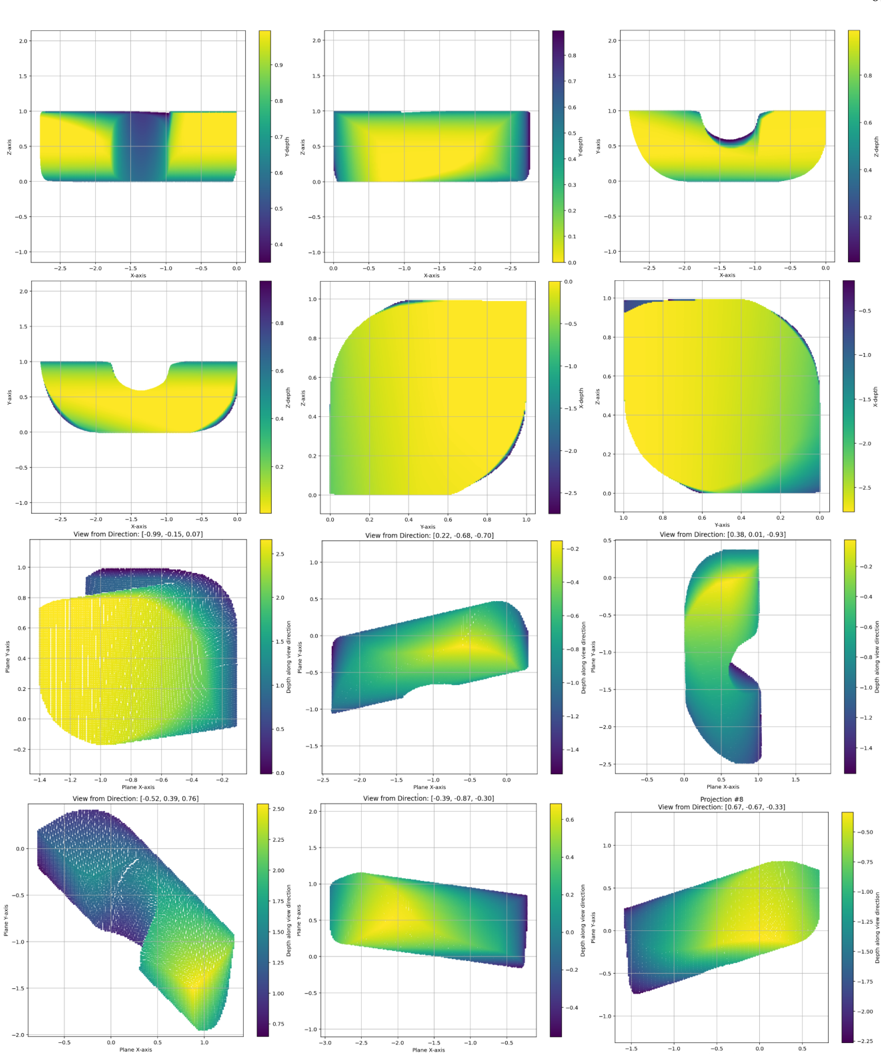
A 4x3 grid of heatmaps visualizing 3D data projections from different view directions. Each heatmap uses a color gradient to represent depth values, with axes labeled X, Y, and Z. The grid includes both orthogonal and oblique projections, with view directions specified as normalized vectors.
### Components/Axes
1. **Axes Labels**:
- X-axis: "Plane X-axis" (bottom) or "X-axis" (top)
- Y-axis: "Plane Y-axis" (bottom) or "Y-axis" (top)
- Z-axis: "Z-axis" (left) or "Depth along view direction" (right)
2. **Color Scales**:
- Right-side legends show depth values ranging from -2.5 to 2.5, with gradients from purple (low) to yellow (high).
- Some heatmaps use inverted scales (e.g., 0.0 to -2.5).
3. **View Directions**:
- Specified as normalized vectors (e.g., [-0.99, -0.15, 0.07]) in titles.
- Arrows indicate projection direction in some plots.
### Detailed Analysis
#### Top Row (Projections #1-3)
1. **Projection #1**
- **Axes**: X (0–2), Z (-1–1), Y (0–2)
- **Color Scale**: 0.4–0.9
- **Pattern**: Horizontal band with gradient from purple (left) to yellow (right).
- **View Direction**: [-0.99, -0.15, 0.07]
2. **Projection #2**
- **Axes**: X (0–2), Z (-1–1), Y (0–2)
- **Color Scale**: 0.1–0.8
- **Pattern**: Vertical gradient from purple (bottom) to yellow (top).
- **View Direction**: [-0.22, -0.68, -0.70]
3. **Projection #3**
- **Axes**: X (0–2), Z (-1–1), Y (0–2)
- **Color Scale**: 0.0–0.8
- **Pattern**: U-shaped void in the center.
- **View Direction**: [-0.38, 0.01, 0.93]
#### Middle Row (Projections #4-6)
4. **Projection #4**
- **Axes**: X (-2.5–0), Y (-1–1), Z (0–2)
- **Color Scale**: 0.0–0.8
- **Pattern**: Quarter-circle in the top-right quadrant.
- **View Direction**: [-0.52, 0.39, 0.76]
5. **Projection #5**
- **Axes**: X (-2.5–0), Y (-1–1), Z (0–2)
- **Color Scale**: -1.4–2.5
- **Pattern**: Diagonal gradient from bottom-left (purple) to top-right (yellow).
- **View Direction**: [-0.67, -0.67, -0.33]
6. **Projection #6**
- **Axes**: X (-2.5–0), Y (-1–1), Z (0–2)
- **Color Scale**: -1.2–2.5
- **Pattern**: Vertical gradient with a hollow center.
- **View Direction**: [-0.39, -0.87, -0.30]
#### Bottom Row (Projections #7-9)
7. **Projection #7**
- **Axes**: X (-3–0), Y (-1–1), Z (0–2)
- **Color Scale**: -2.0–2.5
- **Pattern**: Diagonal gradient with a sharp corner.
- **View Direction**: [-0.67, -0.67, -0.33]
8. **Projection #8**
- **Axes**: X (-3–0), Y (-1–1), Z (0–2)
- **Color Scale**: -1.0–2.5
- **Pattern**: Horizontal gradient with a curved edge.
- **View Direction**: [-0.52, 0.39, 0.76]
9. **Projection #9**
- **Axes**: X (-3–0), Y (-1–1), Z (0–2)
- **Color Scale**: -0.6–2.5
- **Pattern**: Diagonal gradient with a triangular void.
- **View Direction**: [-0.38, 0.01, 0.93]
### Key Observations
1. **Depth Correlation**: Yellow regions consistently represent higher depth values across all heatmaps.
2. **View Direction Impact**: Oblique projections (e.g., #3, #6) reveal internal structures not visible in orthogonal views.
3. **Anomalies**:
- Projection #5 shows a negative depth scale (-1.4 to 2.5), suggesting inverted data or a coordinate system mismatch.
- Projection #7 has a sharp corner, indicating a discontinuity in the data.
### Interpretation
The heatmaps demonstrate how 3D data appears under different viewing angles. The color gradients quantify depth perception, with yellow indicating surfaces closest to the viewer. Negative depth values (purple) suggest features receding into the scene. The U-shaped voids (e.g., #3) and diagonal gradients (e.g., #5) imply complex geometries or directional lighting effects. The inverted scale in #5 may indicate a data preprocessing error or a deliberate choice to highlight specific features. These projections collectively provide a comprehensive spatial analysis, critical for applications like 3D modeling or medical imaging.