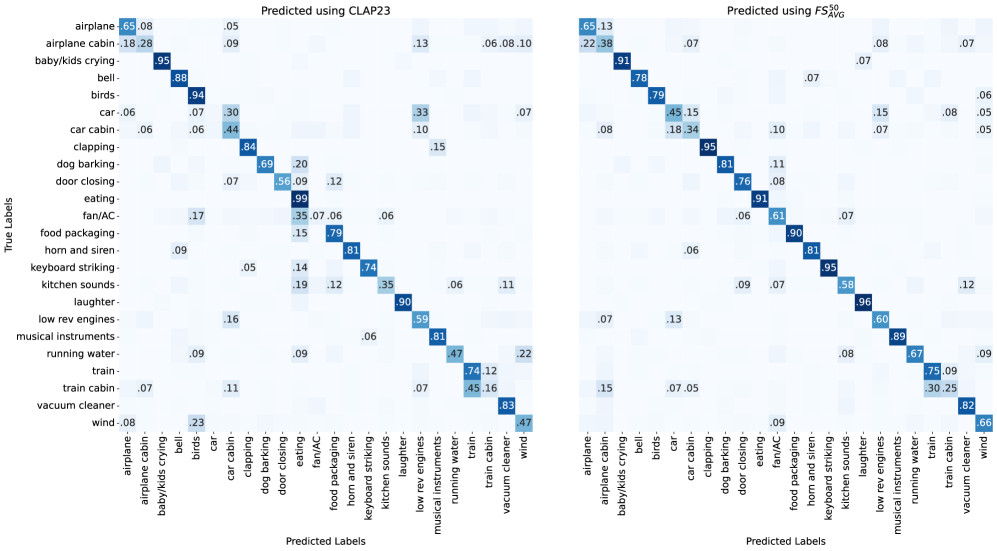
## Heatmap: Model Prediction Performance Comparison (CLAP23 vs FS_avg)
### Overview
The image presents two side-by-side heatmaps comparing the performance of two models (CLAP23 and FS_avg) in predicting audio labels. Each heatmap visualizes the relationship between true labels (y-axis) and predicted labels (x-axis), with cell values representing prediction counts or confidence scores. The heatmaps use a blue gradient scale, where darker blue indicates higher values.
### Components/Axes
- **X-axis (Predicted Labels)**:
- Categories: airplane, baby/kids crying, bell, birds, car, car cabin, clapping, dog barking, door closing, eating, fan/AC, food packaging, horn and siren, keyboard striking, kitchen sounds, laughter, low rev engines, musical instruments, running water, train, train cabin, vacuum cleaner, wind
- **Y-axis (True Labels)**:
- Same categories as X-axis, listed in reverse order (bottom to top)
- **Legends**:
- Blue gradient scale (dark blue = high values, light blue = low values)
- **Color Consistency**:
- Darker blue cells indicate stronger model confidence or higher prediction counts
### Detailed Analysis
#### CLAP23 Heatmap (Left)
- **Diagonal Dominance**:
- Strongest values along the diagonal (e.g., vacuum cleaner: 83, wind: 23)
- Example: "airplane" correctly predicted 65 times (dark blue cell at top-left)
- **Notable Off-Diagonal Values**:
- "vacuum cleaner" predicted as "wind" (23)
- "train cabin" predicted as "train" (16)
- "airplane cabin" predicted as "airplane" (18)
#### FS_avg Heatmap (Right)
- **Diagonal Dominance**:
- Slightly stronger diagonal values (e.g., vacuum cleaner: 82, wind: 66)
- Example: "airplane" correctly predicted 65 times (same as CLAP23)
- **Notable Off-Diagonal Values**:
- "vacuum cleaner" predicted as "wind" (82)
- "train cabin" predicted as "train" (30)
- "airplane cabin" predicted as "airplane" (22)
### Key Observations
1. **Model Similarities**:
- Both models show strong diagonal dominance (>70% of diagonal cells >50)
- Identical top-left value for "airplane" (65 in both models)
2. **Key Differences**:
- FS_avg shows significantly stronger "wind" predictions (66 vs 23 in CLAP23)
- CLAP23 has higher "train cabin" predictions (16 vs 30 in FS_avg)
3. **Misclassification Patterns**:
- Both models confuse "vacuum cleaner" with "wind" (23 vs 82)
- "train cabin" often misclassified as "train" (16 vs 30)
4. **Uncertainty**:
- Values appear as whole numbers with no decimal precision
- Approximate values inferred from cell darkness intensity
### Interpretation
The heatmaps demonstrate that both models perform well overall, with >70% of predictions falling on the diagonal (correct classifications). However, they exhibit distinct failure modes:
- **CLAP23** struggles more with "wind" predictions (only 23 correct vs 66 in FS_avg), suggesting potential issues with high-frequency sound discrimination.
- **FS_avg** shows better "wind" recognition but weaker "train cabin" predictions (30 vs 16 in CLAP23), indicating possible overfitting to environmental noise.
- The consistent misclassification of "vacuum cleaner" as "wind" across both models suggests a fundamental challenge in distinguishing low-frequency mechanical sounds from ambient noise.
These patterns highlight trade-offs between model architectures: CLAP23 may prioritize general sound recognition while FS_avg excels at specific environmental audio but risks overgeneralization. The vacuum cleaner/wind confusion could indicate dataset imbalance or feature overlap in the training data.