## Chart: Performance vs. CLIP Batch Size
### Overview
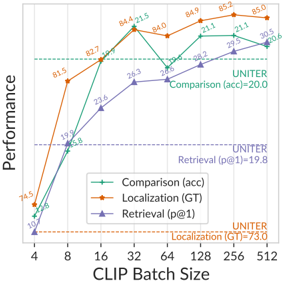
This chart displays the performance of three different tasks (Comparison, Localization, and Retrieval) as a function of the CLIP Batch Size. The performance is measured in terms of accuracy (acc) for Comparison, ground truth (GT) for Localization, and precision at 1 (p@1) for Retrieval. The x-axis represents the CLIP Batch Size, and the y-axis represents the performance metric.
### Components/Axes
* **X-axis:** CLIP Batch Size, with values 4, 8, 16, 32, 64, 128, 256, 512.
* **Y-axis:** Performance (no specific units given).
* **Legend (bottom-left):**
* Green: Comparison (acc)
* Orange: Localization (GT)
* Purple: Retrieval (p@1)
* **Horizontal dashed lines:**
* Green: UNITER Comparison (acc) = 20.0
* Orange: UNITER Localization (GT) = 73.0
* Purple: UNITER Retrieval (p@1) = 19.8
### Detailed Analysis
* **Comparison (acc) - Green:**
* Trend: Initially increases sharply, then plateaus and fluctuates.
* Data Points:
* 4: 10.7
* 8: 19.9
* 16: 82.7
* 32: 84.4
* 64: 26.8
* 128: 28.2
* 256: 21.1
* 512: 30.5
* **Localization (GT) - Orange:**
* Trend: Increases rapidly at first, then plateaus.
* Data Points:
* 4: 74.5
* 8: 81.5
* 16: 82.7
* 32: 84.4
* 64: 84.0
* 128: 84.9
* 256: 85.2
* 512: 85.0
* **Retrieval (p@1) - Purple:**
* Trend: Increases, then plateaus.
* Data Points:
* 4: 5.8
* 8: 15.8
* 16: 23.6
* 32: 26.3
* 64: 26.8
* 128: 21.1
* 256: 29.5
* 512: 20.6
### Key Observations
* Localization (GT) consistently outperforms the other two tasks across all batch sizes.
* The performance of Comparison (acc) fluctuates significantly, especially after a batch size of 32.
* The performance of Retrieval (p@1) plateaus after a batch size of 32.
* The horizontal lines indicate the performance of UNITER, which serves as a baseline for comparison.
### Interpretation
The chart suggests that increasing the CLIP Batch Size initially improves the performance of all three tasks. However, after a certain point (around 32), the performance plateaus or even fluctuates. This indicates that there may be diminishing returns to increasing the batch size beyond a certain threshold.
Localization (GT) consistently achieves the highest performance, suggesting that it is the most effective task for the given model and data. The fluctuating performance of Comparison (acc) may indicate that it is more sensitive to the batch size or other factors.
The UNITER baseline provides a point of reference for evaluating the performance of the three tasks. The fact that the tasks often exceed the UNITER baseline suggests that the model is performing well.