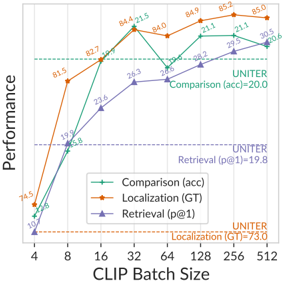
## Line Chart: Performance vs. CLIP Batch Size
### Overview
This chart illustrates the performance metrics of three distinct tasks—Comparison (acc), Localization (GT), and Retrieval (p@1)—across varying CLIP batch sizes (ranging from 4 to 512). The chart also includes horizontal dashed lines representing baseline performance levels for a model referred to as "UNITER" for each respective task.
### Components/Axes
* **X-Axis:** "CLIP Batch Size" (Logarithmic scale). Values: 4, 8, 16, 32, 64, 128, 256, 512.
* **Y-Axis:** "Performance" (Relative scale, no numerical units provided).
* **Legend (Bottom-Center):**
* **Teal line with '+' markers:** Comparison (acc)
* **Orange line with star markers:** Localization (GT)
* **Purple line with triangle markers:** Retrieval (p@1)
* **Baselines:** Three horizontal dashed lines corresponding to "UNITER" performance for each task, labeled with their respective values.
### Detailed Analysis
The chart displays three data series, all showing a general upward trend as the CLIP batch size increases.
**1. Localization (GT) [Orange, Star markers]**
* **Trend:** Starts high and shows a steady, gradual increase, plateauing at higher batch sizes.
* **Data Points:**
* Batch 4