## Line Chart: Performance vs. CLIP Batch Size
### Overview
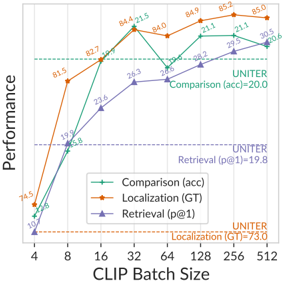
This image presents a line chart illustrating the performance of three different metrics – Comparison (accuracy), Localization (Ground Truth), and Retrieval (p@1) – as a function of CLIP Batch Size. The chart displays how these metrics change as the CLIP Batch Size increases from 4 to 512. Horizontal dashed lines indicate the performance of the UNITER model for Comparison and Retrieval.
### Components/Axes
* **X-axis:** CLIP Batch Size, ranging from 4 to 512. The scale is logarithmic, with markers at 4, 8, 16, 32, 64, 128, 256, and 512.
* **Y-axis:** Performance, ranging from approximately 70 to 86. The axis is labeled "Performance".
* **Data Series:**
* Comparison (acc): Represented by a green line with triangular markers.
* Localization (GT): Represented by an orange line with circular markers.
* Retrieval (p@1): Represented by a purple line with square markers.
* **Legend:** Located in the top-left corner of the chart. It maps colors to the corresponding metrics.
* **Horizontal Dashed Lines:** Two horizontal dashed lines are present.
* A cyan dashed line labeled "UNITER Comparison (acc)=20.0".
* A magenta dashed line labeled "UNITER Retrieval (p@1)=19.8".
* **Text Annotations:**
* "UNITER Localization (GT)=73.0" is located in the bottom-right corner.
### Detailed Analysis
* **Comparison (acc):** The green line starts at approximately 74.5 at a CLIP Batch Size of 4. It increases sharply to 81.5 at a batch size of 8, then continues to rise to 82.7 at 16, peaking at 84.4 at 32. It then drops to 84.0 at 64, rises to 84.9 at 128, reaches a maximum of 85.2 at 256, and finally decreases slightly to 85.0 at 512.
* **Localization (GT):** The orange line begins at approximately 70 at a CLIP Batch Size of 4. It increases rapidly to 81.5 at 8, then to 82.7 at 16, and reaches a peak of 84.4 at 32. It then declines to 84.0 at 64, rises to 84.9 at 128, and continues to 85.2 at 256, before decreasing to 84.5 at 512.
* **Retrieval (p@1):** The purple line starts at approximately 74.5 at a CLIP Batch Size of 4. It increases to 79.8 at 8, then to 82.4 at 16, and to 86.3 at 32. It then drops significantly to 82.6 at 64, rises to 88.2 at 128, reaches 89.5 at 256, and finally decreases to 90.5 at 512.
### Key Observations
* All three metrics generally increase with increasing CLIP Batch Size, but exhibit varying degrees of fluctuation.
* The Retrieval (p@1) metric consistently demonstrates the highest performance across all batch sizes.
* The Localization (GT) and Comparison (acc) metrics show similar trends, with Localization slightly outperforming Comparison at lower batch sizes.
* The performance of all metrics appears to plateau or even decrease at higher batch sizes (256 and 512).
* The UNITER model's performance is significantly lower than the performance achieved by the other metrics at all batch sizes.
### Interpretation
The chart suggests that increasing the CLIP Batch Size generally improves the performance of the Comparison, Localization, and Retrieval metrics, up to a certain point. The plateauing or decrease in performance at higher batch sizes could indicate diminishing returns or potential overfitting. The Retrieval metric consistently outperforms the others, suggesting it is the most robust to changes in batch size. The significant gap between the UNITER model's performance and the performance of the other metrics suggests that UNITER may not be as effective as the other models under the tested conditions. The fluctuations in performance across different batch sizes may be due to the inherent variability in the data or the specific implementation of the models. The chart provides valuable insights into the relationship between CLIP Batch Size and model performance, which can be used to optimize model training and deployment.