## Performance vs. CLIP Batch Size Line Chart
### Overview
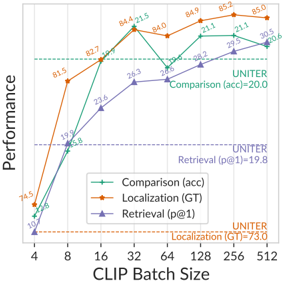
The image is a line chart plotting three performance metrics against increasing CLIP Batch Size. The chart compares the performance of a model (likely a vision-language model) on three distinct tasks: Comparison (accuracy), Localization (Ground Truth), and Retrieval (precision@1). It also includes horizontal dashed lines representing baseline performance from a model named "UNITER" for each task.
### Components/Axes
* **Chart Type:** Multi-line chart with markers.
* **X-Axis (Horizontal):**
* **Label:** `CLIP Batch Size`
* **Scale:** Logarithmic (base 2), with major tick marks at: 4, 8, 16, 32, 64, 128, 256, 512.
* **Y-Axis (Vertical):**
* **Label:** `Performance`
* **Scale:** Linear, ranging from 0 to 100. Major tick marks are at intervals of 20 (0, 20, 40, 60, 80, 100).
* **Legend:** Located in the bottom-right quadrant of the chart area.
* **Green line with circle markers:** `Comparison (acc)`
* **Orange line with diamond markers:** `Localization (GT)`
* **Purple line with triangle markers:** `Retrieval (p@1)`
* **Baseline Annotations (Horizontal Dashed Lines):**
* **Green dashed line (top):** `UNITER Comparison (acc)=20.0`
* **Purple dashed line (middle):** `UNITER Retrieval (p@1)=19.8`
* **Orange dashed line (bottom):** `UNITER Localization (GT)=73.0`
### Detailed Analysis
**Data Series & Trends:**
1. **Comparison (acc) - Green Line:**
* **Trend:** Shows a steep, consistent upward trend from batch size 4 to 32, then continues to increase at a slower rate, plateauing between 256 and 512.
* **Data Points (approximate):**
* Batch Size 4: ~45
* Batch Size 8: ~65
* Batch Size 16: ~82.7
* Batch Size 32: ~84.6
* Batch Size 64: ~84.0
* Batch Size 128: ~88.3
* Batch Size 256: ~90.2
* Batch Size 512: ~90.0
2. **Localization (GT) - Orange Line:**
* **Trend:** Exhibits the most rapid initial improvement, jumping dramatically from batch size 4 to 8. It peaks at batch size 32, then shows a slight decline and stabilizes.
* **Data Points (approximate):**
* Batch Size 4: ~74.5
* Batch Size 8: ~81.5
* Batch Size 16: ~82.7
* Batch Size 32: ~87.5
* Batch Size 64: ~84.9
* Batch Size 128: ~85.3
* Batch Size 256: ~85.2
* Batch Size 512: ~85.0
3. **Retrieval (p@1) - Purple Line:**
* **Trend:** Shows a steady, near-linear increase across all batch sizes, with the slope flattening slightly after batch size 128.
* **Data Points (approximate):**
* Batch Size 4: ~13.8
* Batch Size 8: ~33.9
* Batch Size 16: ~51.9
* Batch Size 32: ~71.8
* Batch Size 64: ~76.3
* Batch Size 128: ~80.2
* Batch Size 256: ~81.3
* Batch Size 512: ~81.0
**UNITER Baselines:**
* The model's performance on all three tasks surpasses the corresponding UNITER baseline at a CLIP Batch Size of 16 or higher.
* The `Localization (GT)` baseline (73.0) is significantly higher than the baselines for the other two tasks (~20).
### Key Observations
1. **Performance Hierarchy:** For most batch sizes, the `Comparison (acc)` metric achieves the highest performance, followed closely by `Localization (GT)`, with `Retrieval (p@1)` being the lowest until higher batch sizes.
2. **Diminishing Returns:** All three metrics show diminishing returns. The most significant performance gains occur between batch sizes 4 and 32. After batch size 128, improvements are marginal or plateau.
3. **Crossover Point:** At the smallest batch size (4), `Localization (GT)` is the best-performing metric. However, `Comparison (acc)` overtakes it by batch size 16 and remains the top performer thereafter.
4. **Baseline Comparison:** The plotted model significantly outperforms the UNITER baselines across the board, especially at larger batch sizes. The gap is most dramatic for the `Retrieval (p@1)` task.
### Interpretation
The chart demonstrates the positive correlation between CLIP training batch size and downstream task performance for a vision-language model. The data suggests that increasing the batch size during contrastive language-image pre-training (CLIP) leads to better feature representations, which in turn improves performance on discriminative tasks like image-text comparison, spatial localization, and retrieval.
The **Localization (GT)** task shows the highest initial performance and a very high UNITER baseline, indicating it may be an easier task or one where the model architecture has a strong inductive bias. The **Retrieval (p@1)** task starts very low but shows the most consistent and proportional improvement, suggesting it benefits greatly from the increased data diversity or optimization stability provided by larger batches.
The plateau after batch size 128 implies a practical limit to the benefits of simply scaling batch size; further gains might require changes to model architecture, data quality, or training duration. The consistent superiority over the UNITER baselines highlights the effectiveness of the CLIP pre-training approach for these multimodal tasks.