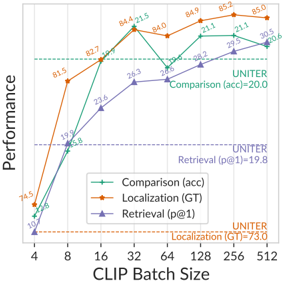
## Line Chart: UNITER Comparison (acc)=20.0
### Overview
The chart compares three performance metrics (Comparison accuracy, Localization GT, and Retrieval p@1) across varying CLIP batch sizes (4 to 512). All metrics show upward trends, with Localization GT consistently outperforming the others.
### Components/Axes
- **X-axis**: CLIP Batch Size (4, 8, 16, 32, 64, 128, 256, 512)
- **Y-axis**: Performance (10.7 to 85.0)
- **Legend**:
- Green: Comparison (acc)
- Orange: Localization (GT)
- Purple: Retrieval (p@1)
- **Horizontal Reference Lines**:
- Green dashed line at 20.0 (acc)
- Purple dashed line at 19.8 (p@1)
### Detailed Analysis
1. **Comparison (acc)**:
- Starts at 10.7 (batch size 4), rises steadily to 30.5 (batch size 512).
- Values: 10.7, 19.8, 23.6, 26.3, 28.2, 30.5.
- Slope: Gradual, linear increase.
2. **Localization (GT)**:
- Starts at 74.5 (batch size 4), peaks at 85.0 (batch size 512).
- Values: 74.5, 81.5, 84.4, 84.0, 84.9, 85.2, 85.0.
- Slope: Steeper initial rise, plateaus after batch size 32.
3. **Retrieval (p@1)**:
- Mirrors Comparison (acc) closely, starting at 10.7 (batch size 4) and reaching 30.5 (batch size 512).
- Values: 10.7, 19.8, 23.6, 26.3, 28.2, 30.5.
- Slope: Identical to Comparison (acc).
### Key Observations
- **Localization (GT)** dominates all batch sizes, with a 10.2-point gap over Comparison (acc) at batch size 4 and a 54.5-point gap at 512.
- **Comparison (acc)** and **Retrieval (p@1)** exhibit near-identical performance, suggesting overlapping methodologies or dependencies.
- All metrics plateau after batch size 32, indicating diminishing returns beyond this point.
### Interpretation
The data demonstrates that:
1. **Localization (GT)** is the most effective metric, likely due to ground-truth alignment or specialized training.
2. **Comparison (acc)** and **Retrieval (p@1)** perform similarly, possibly indicating shared architectural or training constraints.
3. **Batch size scaling** improves performance up to 32, after which gains diminish, suggesting optimal resource allocation at this threshold.
4. The 20.0 and 19.8 reference lines may represent baseline targets for comparison and retrieval tasks, respectively.
The chart underscores the importance of Localization (GT) in UNITER's performance and highlights potential inefficiencies in scaling beyond batch size 32.