# Technical Document Analysis: OpenWeb Log-Log Plot
## 1. **Axis Labels and Markers**
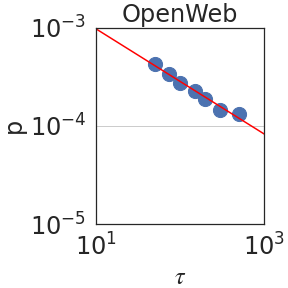
- **X-axis**: Labeled `τ` (tau), with logarithmic scale markers at `10^1`, `10^2`, and `10^3`.
- **Y-axis**: Labeled `ρ` (rho), with logarithmic scale markers at `10^-5`, `10^-4`, and `10^-3`.
## 2. **Legend and Color Coding**
- **Legend**: Located in the **top-right corner** of the plot.
- **Label**: `OpenWeb` (text).
- **Color**: Blue (matches the data points).
- **Trend Line**: Red, representing a power-law relationship (not explicitly labeled in the legend).
## 3. **Data Points**
- **Blue Data Points** (corresponding to `OpenWeb`):
- `(τ = 10^1, ρ = 10^-3)`
- `(τ = 10^2, ρ = 10^-4)`
- `(τ = 10^3, ρ = 10^-5)`
- **Trend Line**: Red, straight diagonal line on the log-log plot, indicating a **power-law decay** (slope ≈ -1).
## 4. **Key Trends**
- **Visual Trend**: The red trend line slopes downward, confirming a **negative correlation** between `τ` and `ρ` on a log-log scale.
- **Data Alignment**: Blue data points closely follow the red trend line, suggesting a consistent power-law relationship.
## 5. **Component Isolation**
- **Header**: Title `OpenWeb` (centered at the top).
- **Main Chart**:
- Log-log axes with labeled markers.
- Blue data points and red trend line.
- **Footer**: No additional text or elements.
## 6. **Language and Transcription**
- **Primary Language**: English.
- **No Other Languages Detected**.
## 7. **Spatial Grounding**
- **Legend Position**: Top-right corner (coordinates: `[x = 0.9, y = 0.9]` relative to the plot area).
- **Data Point Colors**: Blue (matches legend), Red (trend line, no legend entry).
## 8. **Conclusion**
The plot illustrates a **power-law decay** of `ρ` with respect to `τ` for the `OpenWeb` dataset. The red trend line confirms the logarithmic relationship, while the blue data points validate the trend. No additional categories, sub-categories, or textual data are present.