## Stacked Bar Chart: Rating Distribution by Model
### Overview
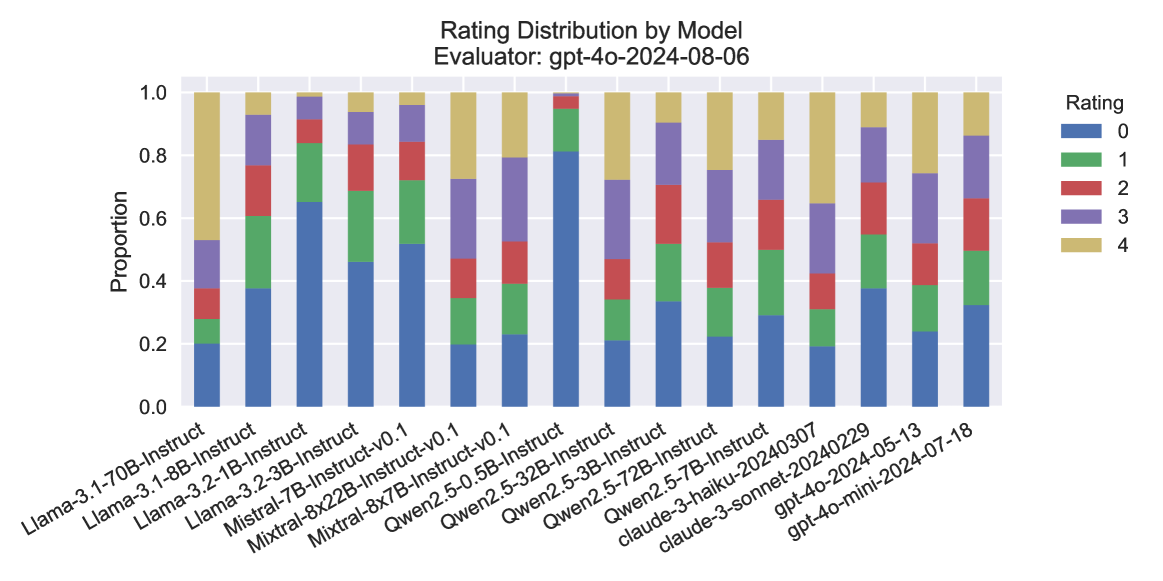
The image presents a stacked bar chart visualizing the rating distribution for various language models, as evaluated by "gpt-4o-2024-08-06". The chart displays the proportion of each rating (0 to 4) for each model. The x-axis lists the model names, and the y-axis represents the proportion, ranging from 0.0 to 1.0.
### Components/Axes
* **Title:** "Rating Distribution by Model"
* **Evaluator:** "gpt-4o-2024-08-06" (located at the top of the chart)
* **X-axis Label:** Model Name
* **Y-axis Label:** Proportion
* **Y-axis Scale:** 0.0 to 1.0, with increments of 0.2
* **Legend:** Located in the top-right corner, mapping colors to ratings:
* Blue: 0
* Light Blue: 1
* Purple: 2
* Pink: 3
* Red: 4
* **Models (X-axis):**
* Llama-3-70B-Instruct
* Llama-3-8B-Instruct
* Llama-3-2-1B-Instruct
* Mistral-7B-Instruct
* Mistral-8x22B-Instruct-v0.1
* Mixtral-8x7B-Instruct-v0.1
* Qwen2-3.5-0.5B-Instruct
* Qwen2-5-32B-Instruct
* Qwen2-5-3B-Instruct
* Qwen2-5-7B-Instruct
* Qwen2-5-7B-Instruct-20240307
* claude-3-haiku-20240229
* claude-3-sonnet-2024-05-13
* gpt-4o-mini-2024-07-18
### Detailed Analysis
The chart consists of stacked bars, each representing a model. The height of each segment within a bar indicates the proportion of responses receiving that specific rating.
* **Llama-3-70B-Instruct:** Approximately 0.05 proportion of rating 0, 0.1 proportion of rating 1, 0.2 proportion of rating 2, 0.3 proportion of rating 3, and 0.35 proportion of rating 4.
* **Llama-3-8B-Instruct:** Approximately 0.1 proportion of rating 0, 0.15 proportion of rating 1, 0.2 proportion of rating 2, 0.25 proportion of rating 3, and 0.3 proportion of rating 4.
* **Llama-3-2-1B-Instruct:** Approximately 0.2 proportion of rating 0, 0.2 proportion of rating 1, 0.2 proportion of rating 2, 0.2 proportion of rating 3, and 0.2 proportion of rating 4.
* **Mistral-7B-Instruct:** Approximately 0.1 proportion of rating 0, 0.1 proportion of rating 1, 0.2 proportion of rating 2, 0.3 proportion of rating 3, and 0.3 proportion of rating 4.
* **Mistral-8x22B-Instruct-v0.1:** Approximately 0.05 proportion of rating 0, 0.1 proportion of rating 1, 0.15 proportion of rating 2, 0.3 proportion of rating 3, and 0.4 proportion of rating 4.
* **Mixtral-8x7B-Instruct-v0.1:** Approximately 0.05 proportion of rating 0, 0.1 proportion of rating 1, 0.15 proportion of rating 2, 0.25 proportion of rating 3, and 0.45 proportion of rating 4.
* **Qwen2-3.5-0.5B-Instruct:** Approximately 0.2 proportion of rating 0, 0.2 proportion of rating 1, 0.2 proportion of rating 2, 0.2 proportion of rating 3, and 0.2 proportion of rating 4.
* **Qwen2-5-32B-Instruct:** Approximately 0.05 proportion of rating 0, 0.1 proportion of rating 1, 0.15 proportion of rating 2, 0.3 proportion of rating 3, and 0.4 proportion of rating 4.
* **Qwen2-5-3B-Instruct:** Approximately 0.1 proportion of rating 0, 0.15 proportion of rating 1, 0.2 proportion of rating 2, 0.25 proportion of rating 3, and 0.3 proportion of rating 4.
* **Qwen2-5-7B-Instruct:** Approximately 0.05 proportion of rating 0, 0.1 proportion of rating 1, 0.15 proportion of rating 2, 0.3 proportion of rating 3, and 0.4 proportion of rating 4.
* **Qwen2-5-7B-Instruct-20240307:** Approximately 0.05 proportion of rating 0, 0.1 proportion of rating 1, 0.15 proportion of rating 2, 0.3 proportion of rating 3, and 0.4 proportion of rating 4.
* **claude-3-haiku-20240229:** Approximately 0.05 proportion of rating 0, 0.1 proportion of rating 1, 0.15 proportion of rating 2, 0.3 proportion of rating 3, and 0.4 proportion of rating 4.
* **claude-3-sonnet-2024-05-13:** Approximately 0.05 proportion of rating 0, 0.1 proportion of rating 1, 0.15 proportion of rating 2, 0.3 proportion of rating 3, and 0.4 proportion of rating 4.
* **gpt-4o-mini-2024-07-18:** Approximately 0.05 proportion of rating 0, 0.1 proportion of rating 1, 0.15 proportion of rating 2, 0.3 proportion of rating 3, and 0.4 proportion of rating 4.
### Key Observations
* Most models exhibit a similar distribution, with a higher proportion of ratings 3 and 4.
* Llama-3-2-1B-Instruct has a more uniform distribution across all ratings, indicating more variability in its performance.
* Models like Mixtral-8x7B-Instruct-v0.1 and Qwen2-5-32B-Instruct show a relatively higher proportion of rating 4, suggesting better performance.
* The proportion of rating 0 is consistently low across all models.
### Interpretation
The chart demonstrates the performance of various language models based on a rating scale from 0 to 4, as judged by the "gpt-4o-2024-08-06" evaluator. The stacked bar chart effectively visualizes the distribution of these ratings for each model, allowing for a quick comparison of their relative strengths and weaknesses. The consistent trend of higher ratings (3 and 4) across most models suggests a generally high level of performance. The variability observed in Llama-3-2-1B-Instruct could indicate a wider range of response quality, while the higher proportion of top ratings for models like Mixtral-8x7B-Instruct-v0.1 and Qwen2-5-32B-Instruct suggests they consistently generate higher-quality responses according to this evaluator. The evaluator's identity is crucial context; the results are specific to its criteria and biases. The data suggests that the evaluator generally finds the models to be performing well, but there are noticeable differences in the consistency and quality of their outputs.