## Diagram: Process Flow Transformation (A → B)
### Overview
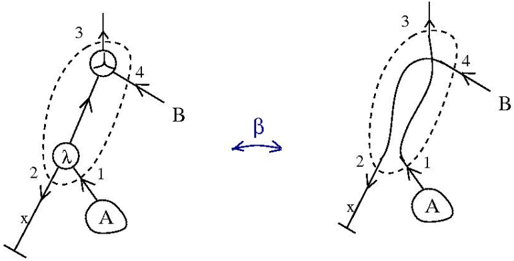
The image depicts two interconnected diagrams labeled **A** and **B**, connected by a bidirectional arrow labeled **β**. Both diagrams feature numbered arrows (1–4), geometric shapes (dashed ovals, circles), and directional flows. The transformation **β** suggests a process or function mapping states between A and B.
### Components/Axes
- **Diagram A (Left)**:
- **Dashed Oval**: Encloses arrows 1, 2, 3, and 4.
- **Arrows**:
- **1**: Points to labeled region **A** (bottom-left).
- **2**: Points to labeled symbol **λ** (intermediate node).
- **3**: Vertical upward arrow (no explicit target).
- **4**: Points to labeled region **B** (top-right).
- **Labels**:
- **A**: Enclosed region (bottom-left).
- **λ**: Intermediate node (center-left).
- **B**: Enclosed region (top-right).
- **Diagram B (Right)**:
- **Dashed Oval**: Distorted compared to A, enclosing arrows 1, 2, 3, and 4.
- **Arrows**:
- **1**: Points to **A** (bottom-left).
- **2**: Points to **λ** (center-left).
- **3**: Curved upward arrow (no explicit target).
- **4**: Points to **B** (top-right).
- **Labels**:
- **A**: Enclosed region (bottom-left).
- **λ**: Intermediate node (center-left).
- **B**: Enclosed region (top-right).
- **Transformation β**:
- Bidirectional arrow between A and B, suggesting a reversible or iterative process.
### Detailed Analysis
- **Arrow Directions**:
- In both diagrams, arrows 1 and 2 consistently point to **A** and **λ**, respectively.
- Arrow 3 in Diagram A is vertical, while in Diagram B it curves upward, indicating a structural change in the process flow.
- Arrow 4 in both diagrams points to **B**, maintaining consistency in the final state.
- **Geometric Shapes**:
- The dashed ovals in A and B enclose the same set of arrows but differ in shape (circular vs. elongated), possibly representing different process boundaries or states.
- **Symbol λ**:
- Appears as an intermediate node in both diagrams, acting as a connector between **A** and **B**.
### Key Observations
1. **Structural Rearrangement**: The distortion of the dashed oval in Diagram B and the curved arrow 3 suggest a modification in the process flow or constraints.
2. **Consistency in Labels**: **A**, **λ**, and **B** remain constant across both diagrams, implying they are fixed states or regions.
3. **Bidirectional β**: The reversible arrow between A and B indicates the process can operate in both directions.
### Interpretation
The diagrams likely represent a **state transition system** or **process optimization scenario**:
- **A** and **B** could denote initial and final states, with **λ** as an intermediate step.
- The transformation **β** might symbolize a function (e.g., algorithm, physical process) that maps between these states.
- The structural differences between the diagrams (e.g., curved arrow 3, distorted oval) imply trade-offs or adjustments in the process efficiency or constraints.
- The bidirectional β suggests the system is reversible, allowing for feedback or iterative refinement.
This visualization emphasizes the relationship between components and the impact of process modifications on system behavior.