## Scatter Plot: Syntax Accuracy vs. LM Arena Rank
### Overview
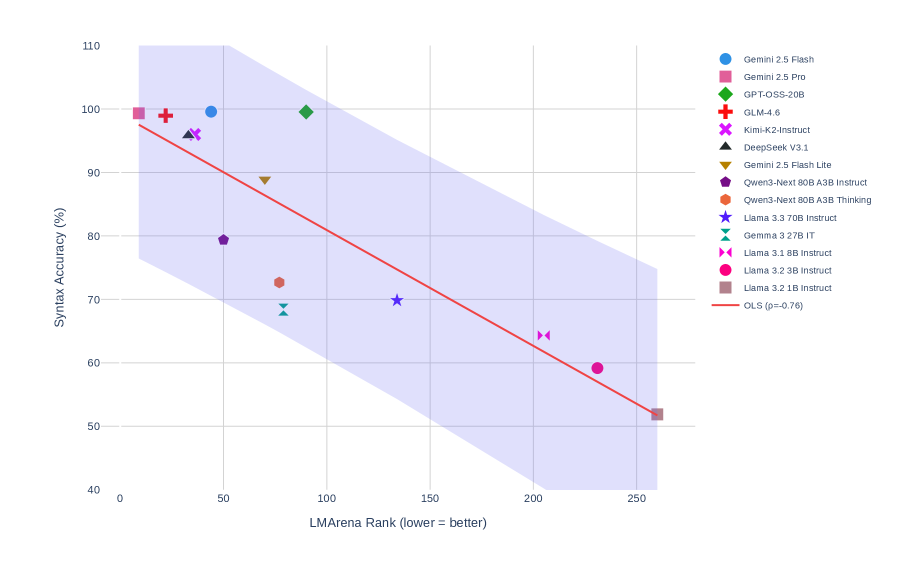
This image presents a scatter plot illustrating the relationship between Syntax Accuracy (%) and LM Arena Rank. The plot displays data points representing various language models, along with a regression line indicating the overall trend. The x-axis represents the LM Arena Rank (lower is better), and the y-axis represents Syntax Accuracy (%). A legend in the top-right corner identifies each language model by color and shape.
### Components/Axes
* **X-axis:** LM Arena Rank (lower = better). Scale ranges from approximately 0 to 250, with markers at 0, 50, 100, 150, 200, and 250.
* **Y-axis:** Syntax Accuracy (%). Scale ranges from approximately 40 to 110, with markers at 40, 50, 60, 70, 80, 90, 100, and 110.
* **Legend:** Located in the top-right corner, listing the following language models with corresponding colors and shapes:
* Gemini 2.5 Flash (Red Circle)
* Gemini 2.5 Pro (Brown Circle)
* GPT-OSS-20B (Green Circle)
* GLM-4.6 (Purple Cross)
* Kimi-K2-Instruct (Orange Triangle)
* DeepSeek V3.1 (Grey Triangle)
* Gemini 2.5 Flash Lite (Cyan Triangle)
* Qwen3-Next 80B A3B Instruct (Blue Star)
* Qwen3-Next 80B A3B Thinking (Dark Blue Star)
* Llama 3 3.70B Instruct (Magenta Diamond)
* Gemma 3 27B IT (Dark Green Diamond)
* Llama 3.1 8B Instruct (Pink Hexagon)
* Llama 3.2 3B Instruct (Light Blue Hexagon)
* **Regression Line:** A red line representing the Ordinary Least Squares (OLS) regression with a correlation coefficient (ρ = -0.78). The line slopes downward from left to right.
* **Confidence Interval:** A light blue shaded area surrounding the regression line, representing the confidence interval.
### Detailed Analysis
The data points are scattered across the plot, generally exhibiting a negative correlation between LM Arena Rank and Syntax Accuracy. The regression line confirms this trend.
Here's a breakdown of the approximate data points for each model:
* **Gemini 2.5 Flash (Red Circle):** Approximately (10, 100)
* **Gemini 2.5 Pro (Brown Circle):** Approximately (40, 93)
* **GPT-OSS-20B (Green Circle):** Approximately (20, 95)
* **GLM-4.6 (Purple Cross):** Approximately (60, 87)
* **Kimi-K2-Instruct (Orange Triangle):** Approximately (30, 91)
* **DeepSeek V3.1 (Grey Triangle):** Approximately (100, 75)
* **Gemini 2.5 Flash Lite (Cyan Triangle):** Approximately (180, 62)
* **Qwen3-Next 80B A3B Instruct (Blue Star):** Approximately (120, 70)
* **Qwen3-Next 80B A3B Thinking (Dark Blue Star):** Approximately (200, 60)
* **Llama 3 3.70B Instruct (Magenta Diamond):** Approximately (150, 68)
* **Gemma 3 27B IT (Dark Green Diamond):** Approximately (230, 55)
* **Llama 3.1 8B Instruct (Pink Hexagon):** Approximately (200, 58)
* **Llama 3.2 3B Instruct (Light Blue Hexagon):** Approximately (250, 52)
The regression line starts at approximately (0, 105) and ends at approximately (250, 50).
### Key Observations
* There is a strong negative correlation (ρ = -0.78) between LM Arena Rank and Syntax Accuracy. As the LM Arena Rank increases (indicating a lower ranking), the Syntax Accuracy tends to decrease.
* Gemini 2.5 Flash exhibits the highest Syntax Accuracy and the lowest LM Arena Rank among the models presented.
* Llama 3.2 3B Instruct has the lowest Syntax Accuracy and the highest LM Arena Rank.
* The confidence interval around the regression line indicates the uncertainty in the estimated relationship.
### Interpretation
The data suggests that models with higher rankings on the LM Arena benchmark tend to perform better on syntax accuracy tasks. This is not necessarily a causal relationship, but rather an observed correlation. The negative correlation implies that improving a model's performance on the LM Arena benchmark may also lead to improvements in its ability to generate syntactically correct text.
The regression line provides a general trend, but individual models deviate from this trend. This could be due to various factors, such as differences in model architecture, training data, or specific optimization strategies. The confidence interval highlights the range of plausible values for the relationship between the two variables.
The outlier models, those furthest from the regression line, may represent cases where a model excels or struggles in specific areas not fully captured by the LM Arena benchmark or syntax accuracy metric. Further investigation into these models could reveal valuable insights into the factors that contribute to overall language model performance.