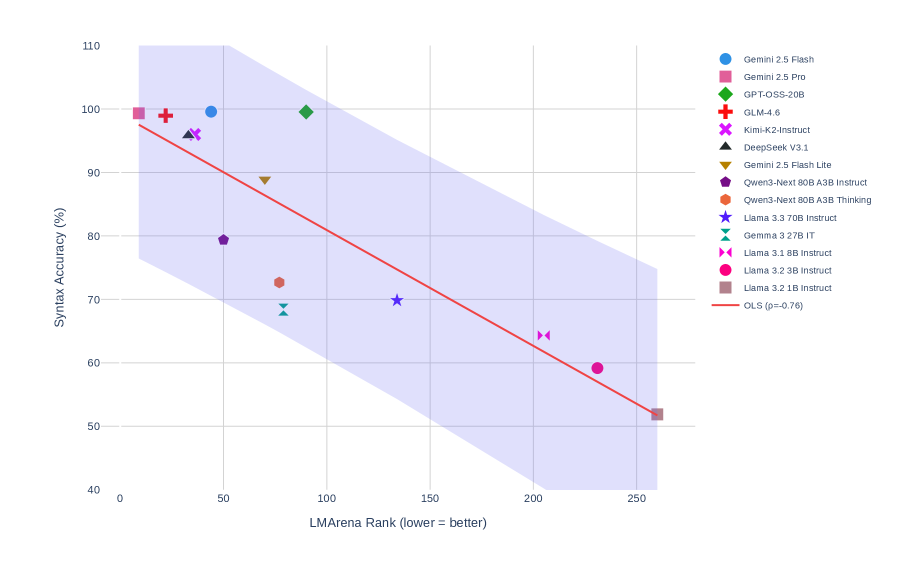
## Scatter Plot with Regression Line: Syntax Accuracy vs. LMArena Rank
### Overview
The image is a scatter plot chart comparing the performance of various Large Language Models (LLMs) on two metrics: "LMArena Rank" on the x-axis and "Syntax Accuracy (%)" on the y-axis. A red Ordinary Least Squares (OLS) regression line with a shaded confidence interval is overlaid, indicating a negative correlation between the two variables. The chart is set against a white background with a light grey grid.
### Components/Axes
* **X-Axis:** Labeled "LMArena Rank (lower = better)". The scale runs from 0 to 250, with major tick marks at 0, 50, 100, 150, 200, and 250.
* **Y-Axis:** Labeled "Syntax Accuracy (%)". The scale runs from 40 to 110, with major tick marks at 40, 50, 60, 70, 80, 90, 100, and 110.
* **Legend:** Positioned in the top-right corner, outside the main plot area. It lists 14 distinct AI models, each associated with a unique colored marker shape.
* **Regression Line:** A solid red line labeled "OLS (p=-0.76)" in the legend. It slopes downward from left to right.
* **Confidence Interval:** A light purple shaded region surrounding the OLS line, representing the uncertainty of the regression.
### Detailed Analysis
**Data Series (Models) and Approximate Coordinates:**
The following list maps each model from the legend to its approximate position on the chart. Coordinates are estimated visually as (LMArena Rank, Syntax Accuracy %).
1. **Gemini 2.5 Flash** (Blue Circle): (~45, ~100)
2. **Gemini 2.5 Pro** (Pink Square): (~10, ~100)
3. **GPT-OSS-20B** (Green Diamond): (~90, ~100)
4. **GLM-4.6** (Red Plus): (~25, ~100)
5. **Kimi-K2-Instruct** (Purple X): (~35, ~96)
6. **DeepSeek V3.1** (Black Triangle): (~35, ~96) *[Note: This marker overlaps closely with Kimi-K2-Instruct]*
7. **Gemini 2.5 Flash Lite** (Brown Inverted Triangle): (~75, ~89)
8. **Qwen3-Next 80B A3B Instruct** (Dark Purple Pentagon): (~50, ~80)
9. **Qwen3-Next 80B A3B Thinking** (Orange Circle): (~75, ~73)
10. **Llama 3.3 70B Instruct** (Blue Star): (~135, ~70)
11. **Gemma 3 27B IT** (Teal Bowtie): (~80, ~69)
12. **Llama 3.1 8B Instruct** (Pink Bowtie): (~205, ~64)
13. **Llama 3.2 3B Instruct** (Pink Circle): (~230, ~59)
14. **Llama 3.2 1B Instruct** (Brown Square): (~260, ~52)
**Regression Analysis:**
* The OLS line has a stated correlation coefficient (p) of -0.76, indicating a strong negative linear relationship.
* The line originates near (0, ~98) and terminates near (260, ~52).
* The shaded confidence interval is widest at the extremes of the x-axis (near rank 0 and 260) and narrowest near the center of the data cluster (around rank 50-100).
### Key Observations
1. **Strong Negative Correlation:** There is a clear visual and statistical trend: models with a better (lower) LMArena Rank tend to have higher Syntax Accuracy scores.
2. **Performance Clustering:** The top-performing models (Syntax Accuracy > 95%) are all clustered in the low-rank region (LMArena Rank < 50).
3. **Outliers/Notable Points:**
* **GPT-OSS-20B** is a high-performing outlier in terms of rank; it achieves ~100% Syntax Accuracy despite having a relatively high (worse) rank of ~90.
* **Llama 3.3 70B Instruct** sits almost exactly on the regression line at (~135, ~70), making it a representative data point for the trend.
* The three smallest Llama models (8B, 3B, 1B) form a clear descending sequence in the bottom-right quadrant, showing both worse rank and lower syntax accuracy.
4. **Data Spread:** The vertical spread (Syntax Accuracy) of models is much greater at lower ranks (e.g., between rank 10-100, accuracy ranges from ~80% to ~100%) than at higher ranks (e.g., beyond rank 200, accuracy is tightly clustered between ~52% and ~64%).
### Interpretation
This chart demonstrates a significant trade-off or relationship between a model's general capability ranking (LMArena Rank) and its specific proficiency in syntactic accuracy. The strong negative correlation (p=-0.76) suggests that models which excel in the broad, likely multi-faceted evaluation of LMArena also tend to be more syntactically precise.
The clustering of top models indicates a performance ceiling or elite tier where high rank and near-perfect syntax accuracy co-occur. The position of **GPT-OSS-20B** is particularly interesting; it suggests this model may have a specialized strength in syntax that outperforms what its general rank would predict, or that the LMArena evaluation weights other factors more heavily.
The widening confidence interval at the extremes highlights greater uncertainty in the trend for the very best and worst-ranked models, likely due to fewer data points in those regions. Overall, the visualization effectively argues that improvements in general model ranking are strongly associated with improvements in a core linguistic capability like syntax.