\n
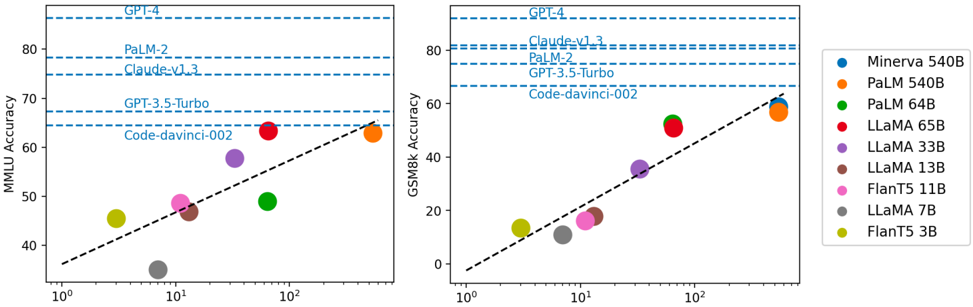
## Scatter Plots: Model Performance on MMLU and GSM8k
### Overview
The image presents two scatter plots comparing the performance of several large language models (LLMs) on two different benchmarks: MMLU (Massive Multitask Language Understanding) and GSM8k (Grade School Math 8k). The x-axis in both plots represents model size, likely in billions of parameters, on a logarithmic scale (10⁰ to 10²). The y-axis represents accuracy. Each point on the plot represents a specific model, and the size of the point appears to be related to the model's size. Horizontal dashed lines indicate the performance of several top-performing models (GPT-4, PaLM-2, Claude-v1.3) on each benchmark.
### Components/Axes
* **X-axis (Both Plots):** Model Size (logarithmic scale, 10⁰, 10¹, 10²) - No units are explicitly stated, but likely billions of parameters.
* **Y-axis (Left Plot):** MMLU Accuracy (0 to 80, approximate)
* **Y-axis (Right Plot):** GSM8k Accuracy (0 to 80, approximate)
* **Horizontal Dashed Lines (Both Plots):** Performance benchmarks for GPT-4, PaLM-2, and Claude-v1.3.
* **Legend (Bottom-Right):**
* Minerva 540B (Blue)
* PaLM 540B (Orange)
* PaLM 64B (Green)
* LLaMA 65B (Red)
* LLaMA 33B (Purple)
* LLaMA 13B (Brown)
* FLanT5 11B (Gray)
* LLaMA 7B (Dark Gray)
* FLanT5 3B (Yellow)
### Detailed Analysis or Content Details
**Left Plot (MMLU Accuracy):**
* **Minerva 540B (Blue):** Approximately 42 accuracy at 10⁰, rising to approximately 48 accuracy at 10¹.
* **PaLM 540B (Orange):** Approximately 44 accuracy at 10⁰, rising to approximately 55 accuracy at 10¹.
* **PaLM 64B (Green):** Approximately 49 accuracy at 10¹.
* **LLaMA 65B (Red):** Approximately 52 accuracy at 10¹, rising to approximately 62 accuracy at 10².
* **LLaMA 33B (Purple):** Approximately 48 accuracy at 10¹.
* **LLaMA 13B (Brown):** Approximately 41 accuracy at 10¹.
* **FLanT5 11B (Gray):** Approximately 44 accuracy at 10¹.
* **LLaMA 7B (Dark Gray):** Approximately 40 accuracy at 10¹.
* **FLanT5 3B (Yellow):** Approximately 42 accuracy at 10⁰, rising to approximately 46 accuracy at 10¹.
**Right Plot (GSM8k Accuracy):**
* **Minerva 540B (Blue):** Approximately 5 accuracy at 10⁰, rising to approximately 20 accuracy at 10¹.
* **PaLM 540B (Orange):** Approximately 10 accuracy at 10⁰, rising to approximately 62 accuracy at 10².
* **PaLM 64B (Green):** Approximately 15 accuracy at 10¹.
* **LLaMA 65B (Red):** Approximately 10 accuracy at 10¹, rising to approximately 50 accuracy at 10².
* **LLaMA 33B (Purple):** Approximately 5 accuracy at 10¹.
* **LLaMA 13B (Brown):** Approximately 2 accuracy at 10¹.
* **FLanT5 11B (Gray):** Approximately 8 accuracy at 10¹.
* **LLaMA 7B (Dark Gray):** Approximately 0 accuracy at 10¹.
* **FLanT5 3B (Yellow):** Approximately 2 accuracy at 10⁰, rising to approximately 10 accuracy at 10¹.
**Trends:**
* In both plots, there is a general upward trend: larger models tend to achieve higher accuracy.
* The relationship appears to be non-linear, with diminishing returns for very large models.
* PaLM 540B shows a particularly strong performance on GSM8k, reaching accuracy levels comparable to GPT-4 and PaLM-2.
* LLaMA 65B shows a strong upward trend on both benchmarks.
### Key Observations
* The performance gap between smaller models (e.g., FLanT5 3B, LLaMA 7B) and larger models (e.g., PaLM 540B, LLaMA 65B) is significant, especially on GSM8k.
* The horizontal lines representing GPT-4, PaLM-2, and Claude-v1.3 serve as upper bounds for performance on each benchmark.
* The scatter plots provide a visual comparison of the trade-offs between model size and accuracy for different LLMs.
### Interpretation
The data suggests a strong correlation between model size and performance on both MMLU and GSM8k benchmarks. However, the relationship is not strictly linear, indicating that simply increasing model size does not guarantee proportional improvements in accuracy. The performance of PaLM 540B on GSM8k is particularly noteworthy, suggesting that architectural choices or training data may play a crucial role in achieving high accuracy on specific tasks. The horizontal lines representing the top-performing models (GPT-4, PaLM-2, Claude-v1.3) provide a benchmark for evaluating the relative performance of other models. The scatter plots allow for a quick visual assessment of which models are approaching or exceeding the performance of these state-of-the-art LLMs. The differing slopes of the trends for each model suggest that some architectures scale more efficiently than others. The data also highlights the importance of considering both MMLU and GSM8k when evaluating LLMs, as performance on one benchmark does not necessarily translate to performance on the other. The logarithmic scale on the x-axis emphasizes the exponential increase in model size and the corresponding, but diminishing, returns in accuracy.