## Scatter Plot Comparison: AI Model Performance on MMLU and GSM8k Benchmarks
### Overview
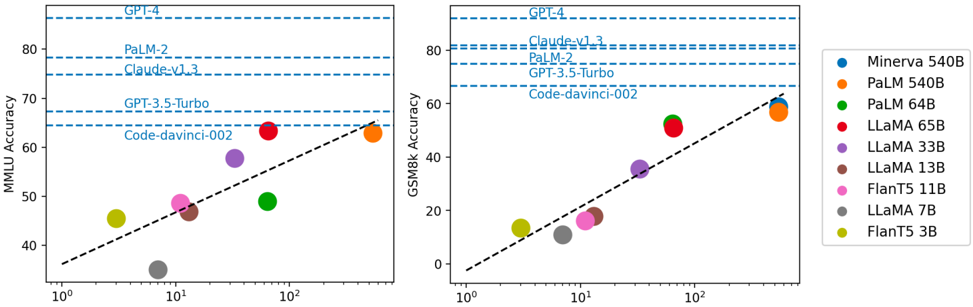
The image displays two side-by-side scatter plots comparing the performance of various large language models (LLMs) on two different academic benchmarks: MMLU (Massive Multitask Language Understanding) and GSM8k (Grade School Math 8K). The plots show model accuracy (y-axis) against a logarithmic scale on the x-axis, which likely represents model size (parameters) or training compute. A legend on the right identifies each model by name and color. Horizontal dashed lines indicate the performance levels of several proprietary models for reference.
### Components/Axes
**Layout:** Two charts arranged horizontally. A shared legend is positioned to the right of the second chart.
**Left Chart:**
* **Title/Y-axis:** "MMLU Accuracy" (scale: 40 to 80+).
* **X-axis:** Logarithmic scale from 10⁰ to 10². No explicit label is provided for the x-axis variable.
* **Reference Lines (Horizontal Dashed Blue):** Labeled from top to bottom: "GPT-4", "PaLM-2", "Claude-v1.3", "GPT-3.5-Turbo", "Code-davinci-002".
* **Trend Line:** A black dashed line showing a positive correlation.
**Right Chart:**
* **Title/Y-axis:** "GSM8k Accuracy" (scale: 0 to 80+).
* **X-axis:** Logarithmic scale from 10⁰ to 10². No explicit label.
* **Reference Lines (Horizontal Dashed Blue):** Labeled from top to bottom: "GPT-4", "Claude-v1.3", "PaLM-2", "GPT-3.5-Turbo", "Code-davinci-002".
* **Trend Line:** A black dashed line showing a positive correlation.
**Legend (Right Side):**
A vertical list mapping model names to colored circle markers:
* Blue: Minerva 540B
* Orange: PaLM 540B
* Green: PaLM 64B
* Red: LLaMA 65B
* Purple: LLaMA 33B
* Brown: LLaMA 13B
* Pink: FlanT5 11B
* Grey: LLaMA 7B
* Yellow-Green: FlanT5 3B
### Detailed Analysis
**Data Points & Approximate Values:**
The following table reconstructs the approximate performance of each model on both benchmarks based on visual estimation from the charts. The x-axis value is estimated from the logarithmic position.
| Model (Color) | Est. X-axis Value | MMLU Accuracy (Left Chart) | GSM8k Accuracy (Right Chart) |
| :--- | :--- | :--- | :--- |
| **Minerva 540B (Blue)** | ~500 | Not plotted on MMLU chart. | ~60% |
| **PaLM 540B (Orange)** | ~500 | ~63% | ~58% |
| **PaLM 64B (Green)** | ~64 | ~49% | ~53% |
| **LLaMA 65B (Red)** | ~65 | ~64% | ~51% |
| **LLaMA 33B (Purple)** | ~33 | ~58% | ~36% |
| **LLaMA 13B (Brown)** | ~13 | ~47% | ~17% |
| **FlanT5 11B (Pink)** | ~11 | ~49% | ~16% |
| **LLaMA 7B (Grey)** | ~7 | ~35% | ~12% |
| **FlanT5 3B (Yellow-Green)** | ~3 | ~45% | ~13% |
**Trend Verification:**
* **MMLU Chart Trend:** The black dashed trend line slopes upward from left to right, indicating a positive correlation between the x-axis metric and MMLU accuracy. Models with higher x-values generally have higher accuracy.
* **GSM8k Chart Trend:** The black dashed trend line also slopes upward, showing a positive correlation. The slope appears steeper than in the MMLU chart, suggesting math performance may scale more dramatically with the x-axis variable.
**Benchmark Reference Lines:**
* **MMLU:** GPT-4 is the highest (~86%), followed by PaLM-2 (~78%), Claude-v1.3 (~75%), GPT-3.5-Turbo (~68%), and Code-davinci-002 (~65%).
* **GSM8k:** GPT-4 is again highest (~92%), followed by Claude-v1.3 (~82%), PaLM-2 (~80%), GPT-3.5-Turbo (~67%), and Code-davinci-002 (~66%).
### Key Observations
1. **Performance Hierarchy:** On both benchmarks, the largest models (Minerva 540B, PaLM 540B) and the proprietary models (GPT-4, PaLM-2, Claude) occupy the top performance tiers.
2. **Scaling Trend:** There is a clear, consistent trend where models with a higher x-axis value (likely larger scale) achieve higher accuracy on both reasoning (MMLU) and math (GSM8k) tasks.
3. **Model Family Comparison:** Within the LLaMA family (Red, Purple, Brown, Grey), performance on both benchmarks decreases predictably as the model size (x-axis value) decreases.
4. **Benchmark Difficulty:** The spread of data points is wider on the GSM8k chart, and the trend line is steeper. This suggests that performance on the math benchmark (GSM8k) is more sensitive to model scale than performance on the general knowledge benchmark (MMLU).
5. **Outlier - Minerva:** Minerva 540B (Blue) is only plotted on the GSM8k chart, where it is the top-performing open model, slightly above PaLM 540B. Its absence from the MMLU chart is notable.
6. **Proprietary vs. Open Models:** The horizontal reference lines show that the top proprietary models (GPT-4, Claude-v1.3, PaLM-2) significantly outperform all the plotted open models on both benchmarks as of the data's timeframe.
### Interpretation
This visualization demonstrates the strong relationship between model scale (represented by the logarithmic x-axis) and performance on standardized academic benchmarks for LLMs. The data suggests that increasing scale is a reliable, though not exclusive, method for improving capabilities in both general knowledge reasoning and mathematical problem-solving.
The steeper slope for GSM8k implies that mathematical reasoning may be a more "scale-sensitive" capability, requiring more parameters or compute to achieve high performance compared to broad knowledge tasks. The clustering of open-source models (LLaMA, FlanT5) below the proprietary benchmark lines highlights the performance gap that existed at the time this data was compiled.
The charts serve as a comparative leaderboard, allowing for quick assessment of where a given model stands relative to its peers and to state-of-the-art proprietary systems. The consistent positive trend across both tasks reinforces the prevailing paradigm in AI research that scaling model size is a primary driver of improved performance on a wide range of cognitive tasks.