## 3D Lattice Diagram
### Overview
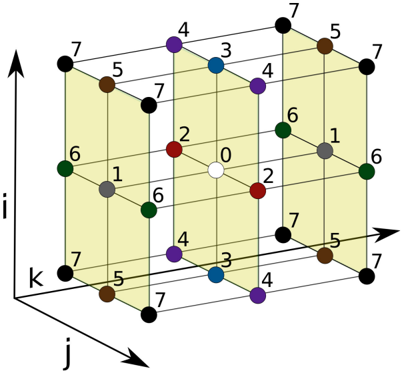
The image is a 3D lattice diagram, visually representing a three-dimensional grid structure. The grid is composed of interconnected nodes, each marked with a number and a distinct color. The diagram also includes three axes labeled 'i', 'j', and 'k', indicating the spatial orientation of the lattice. The lattice appears to be composed of unit cubes, some of which are shaded in yellow.
### Components/Axes
* **Axes:**
* i-axis: Vertical axis, pointing upwards.
* j-axis: Horizontal axis, pointing to the right.
* k-axis: Horizontal axis, pointing to the left and slightly downwards.
* **Nodes:** Each node is represented by a colored circle with a number inside or next to it. The numbers range from 0 to 7.
* **Edges:** The nodes are connected by lines, forming the edges of the lattice.
* **Cubes:** The edges form cubes, some of which are shaded in yellow to provide visual depth.
* **Colors:** The nodes are colored differently. The colors are: white, red, gray, green, blue, purple, brown, and black.
### Detailed Analysis
The lattice consists of 27 nodes arranged in a 3x3x3 cube. The central node is white and labeled "0". The other nodes are colored and numbered as follows:
* **White (0):** Located at the center of the lattice.
* **Red (2):** Two red nodes are present, located adjacent to the white node along the j and i axes.
* **Gray (1):** Two gray nodes are present.
* **Green (6):** Three green nodes are present.
* **Blue (3):** Two blue nodes are present.
* **Purple (4):** Two purple nodes are present.
* **Brown (5):** Two brown nodes are present.
* **Black (7):** Four black nodes are present.
The numbers appear to be assigned based on the position of the node relative to the central node (0). The yellow shading on some of the cubes helps to visualize the 3D structure.
### Key Observations
* The diagram represents a 3D cubic lattice.
* The central node is labeled "0" and colored white.
* The other nodes are numbered from 1 to 7 and colored differently.
* The axes are labeled 'i', 'j', and 'k'.
* The yellow shading helps to visualize the 3D structure.
### Interpretation
The diagram likely represents a spatial data structure or a model of a crystal lattice. The numbers assigned to the nodes could represent different properties or states of the nodes. The colors could be used to distinguish different types of nodes or to represent different values of a certain property. The diagram could be used to visualize and analyze the structure and properties of the lattice. The specific meaning of the numbers and colors would depend on the context in which the diagram is used.