## Diagram: 3D Lattice Coordinate Value Mapping
### Overview
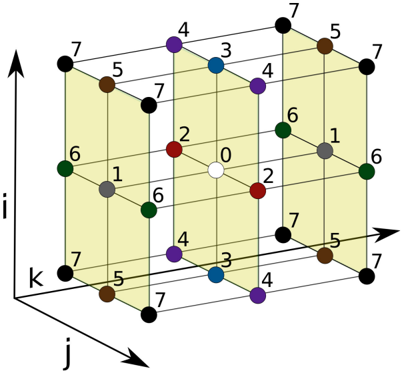
The image displays a 3D grid structure (a $3 \times 3 \times 3$ cube) with colored spherical nodes at each intersection point. Each node is labeled with an integer value ranging from 0 to 7. The diagram is oriented within a 3D coordinate system defined by three axes labeled $i$, $j$, and $k$. The visualization appears to represent a mapping of discrete values to spatial coordinates, likely illustrating a bitwise or index-based relationship within a 3D volume.
### Components/Axes
* **Axes:**
* **$i$ (Vertical):** Represented by an arrow pointing upward.
* **$j$ (Depth):** Represented by an arrow pointing diagonally downward-left.
* **$k$ (Horizontal):** Represented by an arrow pointing to the right.
* **Nodes:** 27 total nodes (some hidden or partially obscured), each color-coded and labeled with an integer.
* **Grid:** A wireframe cube structure defining the spatial relationships between the nodes.
### Detailed Analysis
The nodes are color-coded and positioned relative to the central node (0). Below is the mapping of values to their visual characteristics and approximate spatial positioning:
| Value | Color | Position Relative to Center (0) |
| :--- | :--- | :--- |
| **0** | White | Center of the cube |
| **1** | Grey | Along the $j$-axis (front/back of center) |
| **2** | Red | Along the $k$-axis (left/right of center) |
| **3** | Blue | Top/Bottom of the $k$-axis plane |
| **4** | Purple | Top/Bottom of the $j$-axis plane |
| **5** | Brown | Corners of the cube faces |
| **6** | Dark Green | Along the $i$-axis (up/down of center) |
| **7** | Black | Extreme corners of the cube |
**Spatial Grounding:**
* **Center:** The white node (0) is located at the geometric center of the cube.
* **Axis-Aligned Neighbors:** The nodes immediately adjacent to the center along the axes are:
* Dark Green (6) along the $i$-axis.
* Grey (1) along the $j$-axis.
* Red (2) along the $k$-axis.
* **Planar/Corner Nodes:** The remaining nodes (3, 4, 5, 7) occupy the outer edges and corners of the cube, with values increasing as they move further from the center.
### Key Observations
* **Symmetry:** The diagram exhibits high rotational and reflective symmetry. The values are distributed in a way that suggests a mathematical progression or encoding scheme rather than random data.
* **Value Clustering:** Values are grouped by their distance from the center. The center is 0, the immediate neighbors are 1, 2, and 6, and the outer extremities are 7.
* **Visual Hierarchy:** The color coding creates a distinct visual hierarchy, allowing for the immediate identification of "layers" within the 3D structure.
### Interpretation
This diagram is a classic representation of a **3D bitwise coordinate mapping** or a **voxel-based indexing scheme**.
* **Bitwise Encoding:** The values 0–7 correspond to the 3-bit binary representations ($000_2$ to $111_2$). If we assign the axes $i, j, k$ as bits (e.g., $i=4, j=2, k=1$), the spatial position of each node corresponds to the sum of the active bits.
* For example, the Dark Green node (6) is on the $i$-axis (value 4) and the $k$-axis (value 2), totaling 6.
* The Grey node (1) is on the $j$-axis (value 1), totaling 1.
* The Black node (7) is at the intersection of all three axes ($i+j+k = 4+2+1 = 7$).
* **Purpose:** This type of visualization is commonly used in computer graphics, computational physics, or data structure tutorials to explain how 3D arrays are indexed or how spatial partitioning (like Octrees) functions. It demonstrates how a 3D volume can be linearized into a 1D array of values while maintaining spatial awareness.