\n
## Diagram: 3D Coordinate System with Numerical Labels
### Overview
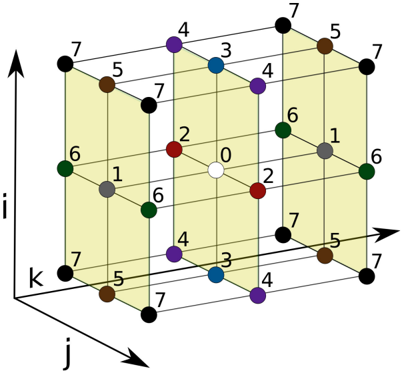
The image depicts a three-dimensional coordinate system, resembling a cube constructed from lines. Each vertex of the cube is labeled with a numerical value ranging from 0 to 7. The axes are labeled 'i', 'j', and 'k', indicating a standard Cartesian coordinate system. The diagram appears to illustrate a mapping of numerical values to specific points within a 3D space.
### Components/Axes
* **Axes:** Three axes are present, labeled 'i' (vertical, pointing upwards), 'j' (horizontal, pointing towards the viewer), and 'k' (horizontal, pointing to the right).
* **Vertices:** The cube has 8 vertices, each marked with a black circle and a numerical label.
* **Numerical Labels:** The labels range from 0 to 7.
* **Color Coding:** Some vertices are colored differently:
* Red
* Blue
* Purple
* Green
* Gray
* Brown
### Detailed Analysis / Content Details
The diagram shows a cube with each corner labeled with a number. The numbers appear to be assigned in a consistent, though not immediately obvious, pattern.
Here's a breakdown of the vertex labels and their approximate positions:
* **(0,0,0):** Label '0', located at the center of the cube. (White circle)
* **(0,0,7):** Label '7', located at the top-right-back corner. (Black circle)
* **(0,7,0):** Label '6', located at the top-left-back corner. (Green circle)
* **(0,7,7):** Label '6', located at the top-right-front corner. (Green circle)
* **(7,0,0):** Label '5', located at the bottom-right-back corner. (Brown circle)
* **(7,0,7):** Label '5', located at the bottom-right-front corner. (Brown circle)
* **(7,7,0):** Label '1', located at the bottom-left-back corner. (Gray circle)
* **(7,7,7):** Label '7', located at the bottom-right-front corner. (Black circle)
Additionally, there are intermediate points within the cube, also labeled:
* **(0,2,0):** Label '2', (Red circle)
* **(0,2,7):** Label '2', (Red circle)
* **(0,4,3):** Label '3', (Blue circle)
* **(0,4,4):** Label '4', (Purple circle)
* **(7,1,6):** Label '1', (Gray circle)
* **(7,3,4):** Label '4', (Purple circle)
* **(7,5,0):** Label '7', (Black circle)
* **(7,5,7):** Label '7', (Black circle)
* **(7,6,2):** Label '2', (Red circle)
* **(7,6,6):** Label '6', (Green circle)
### Key Observations
* The numbers are not simply coordinates.
* The color coding doesn't appear to be directly related to the numerical value.
* The labeling seems to follow a pattern, but it's not a simple linear progression along any single axis.
* The central point (0,0,0) is uniquely labeled '0' and is the only white circle.
### Interpretation
This diagram likely represents a discrete mapping of values within a 3D space. The numbers could represent any kind of data associated with each point in the cube – for example, density, temperature, or a state in a system. The color coding might represent categories or classifications of these values.
The pattern of labeling suggests a possible underlying function or algorithm that assigns these values to the points. Without further context, it's difficult to determine the exact nature of this function. The diagram could be a visualization of a data structure, a simulation result, or a conceptual model.
The fact that some numbers are repeated (e.g., '7' appears multiple times) suggests that the mapping is not necessarily one-to-one. The diagram is a visual representation of a mathematical or computational concept, but its specific meaning requires additional information. It is a visual representation of a discrete space, and the numbers represent some property of each location within that space.