## 3D Lattice Diagram: Numbered and Colored Grid Points
### Overview
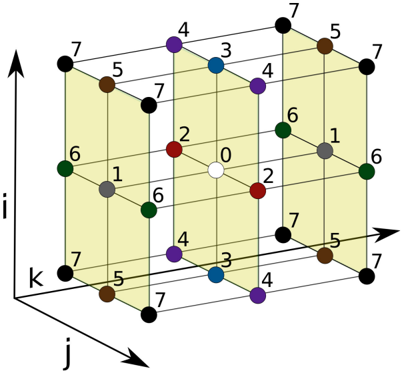
The image displays a three-dimensional lattice or grid structure, specifically a 3x3x3 cubic arrangement of points. Each point is labeled with a numerical value (0 through 7) and is color-coded. The structure is presented in an isometric or perspective view, with three orthogonal axes labeled `i`, `j`, and `k` defining the spatial dimensions. The points are interconnected by a network of lines, forming the edges of the small cubes within the larger lattice.
### Components/Axes
* **Axes:** Three axes are shown, originating from a common origin point (implied at the bottom-left-front corner).
* **i-axis:** Vertical axis, pointing upward.
* **j-axis:** Horizontal axis, pointing to the right.
* **k-axis:** Depth axis, pointing diagonally down and to the left (into the page).
* **Grid Structure:** A 3x3x3 lattice, resulting in 27 total points (nodes).
* **Point Labels:** Each point has a single-digit number (0-7) placed adjacent to it.
* **Point Colors:** Points are colored according to their numerical label. The color-to-number mapping is consistent throughout the diagram.
* **Connections:** Points are connected by straight lines along the `i`, `j`, and `k` directions, forming the wireframe of the cubic lattice.
### Detailed Analysis
**Color-to-Number Legend (Inferred from visual matching):**
* **White:** 0
* **Gray:** 1
* **Red:** 2
* **Blue:** 3
* **Purple:** 4
* **Brown:** 5
* **Green:** 6
* **Black:** 7
**Complete Point Inventory (Organized by approximate spatial layer from bottom to top, front to back):**
**Bottom Layer (Lowest `i` value):**
1. Front-Left: Black, 7
2. Front-Center: Brown, 5
3. Front-Right: Black, 7
4. Middle-Left: Purple, 4
5. Middle-Center: Blue, 3
6. Middle-Right: Purple, 4
7. Back-Left: Black, 7
8. Back-Center: Brown, 5
9. Back-Right: Black, 7
**Middle Layer (Middle `i` value):**
10. Front-Left: Green, 6
11. Front-Center: Gray, 1
12. Front-Right: Green, 6
13. Middle-Left: Red, 2
14. **Center Point:** White, 0 (This is the geometric center of the 3x3x3 cube)
15. Middle-Right: Red, 2
16. Back-Left: Green, 6
17. Back-Center: Gray, 1
18. Back-Right: Green, 6
**Top Layer (Highest `i` value):**
19. Front-Left: Black, 7
20. Front-Center: Brown, 5
21. Front-Right: Black, 7
22. Middle-Left: Purple, 4
23. Middle-Center: Blue, 3
24. Middle-Right: Purple, 4
25. Back-Left: Black, 7
26. Back-Center: Brown, 5
27. Back-Right: Black, 7
**Spatial Distribution & Symmetry:**
* The distribution of numbers/colors is highly symmetric.
* The single **White (0)** point is at the absolute center.
* **Red (2)** points form a small cross or plus sign (+) in the middle plane, surrounding the center.
* **Gray (1)** points are located directly "above" and "below" the center point along the `i` axis (in the middle plane, front and back).
* **Green (6)** points occupy the four corners of the middle plane.
* **Blue (3)** points are located at the centers of the top and bottom faces.
* **Purple (4)** points are at the midpoints of the vertical edges of the top and bottom faces.
* **Brown (5)** points are at the midpoints of the horizontal edges of the top and bottom faces.
* **Black (7)** points occupy all eight corners of the entire 3x3x3 cube.
### Key Observations
1. **Radial Symmetry:** The numbering exhibits clear radial symmetry from the center point (0). Values increase as you move away from the center, but not in a simple linear gradient. The pattern is symmetric across all three axes.
2. **Layered Structure:** The values are not random; they form distinct, symmetric shells or layers around the center.
3. **Color as a Grouping Tool:** The color coding effectively groups points with identical values, making the symmetric pattern visually immediate.
4. **No Explicit Data Trend:** This is a static diagram of a structure, not a chart plotting change over time or variables. Therefore, there are no "trends" in the analytical sense (e.g., increasing/decreasing lines). The "trend" is the spatial pattern of the values themselves.
### Interpretation
This diagram is a technical visualization of a **3D discrete scalar field** or a **labeled lattice model**. It likely represents one of the following:
* **A Mathematical Construct:** It could illustrate a function `f(i, j, k)` defined on a 3D integer grid, where the number is the function's value at that coordinate. The symmetric pattern suggests a function based on distance from the center (e.g., a discrete approximation of a spherical harmonic or a potential field).
* **A Computational Stencil:** In numerical methods (like finite difference or lattice Boltzmann methods), such diagrams represent the "neighborhood" of a central point (0). The numbers could indicate weights, distances, or identifiers for neighboring nodes used in a calculation.
* **A Crystallographic or Group Theory Model:** The symmetric arrangement of labeled points could represent atomic positions in a crystal unit cell with different atom types (colors/numbers) or the elements of a mathematical group visualized in 3D space.
* **A Data Structure:** It could be a visual representation of a 3D array or tensor where each cell holds a specific value.
The core information conveyed is the **precise spatial relationship and value assignment** within this 3D grid. The symmetry is the most salient feature, indicating an underlying rule or function governing the distribution of values. The diagram allows a viewer to instantly grasp the 3D pattern, which would be difficult to convey through a table of coordinates and values alone.