## Star Chart: Early Astronomical Observations
### Overview
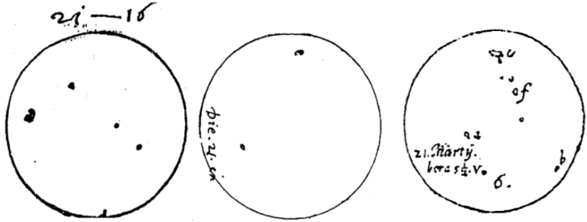
The image presents three circular diagrams, likely representing star charts or astronomical observations. Each circle contains a varying number of dots, presumably indicating the positions of stars or celestial objects. Handwritten annotations accompany each diagram, providing dates and potentially other observational details.
### Components/Axes
* **Diagrams:** Three circular diagrams arranged horizontally.
* **Dots:** Represent stars or celestial objects within each diagram.
* **Annotations:** Handwritten text near each diagram, providing context.
### Detailed Analysis
**Diagram 1 (Left):**
* **Annotation:** "25-16" is written above the circle.
* **Dots:** Contains four dots of varying sizes. One larger dot is located on the left side, with three smaller dots scattered within the circle.
**Diagram 2 (Center):**
* **Annotation:** "Die. 21. en" is written near the bottom-left of the circle.
* "Die." is likely an abbreviation for "Dienstag" (Tuesday in German).
* "21." likely refers to the 21st day of a month.
* "en" is unclear.
* **Dots:** Contains two dots. One is located near the top, and the other is near the bottom-left.
**Diagram 3 (Right):**
* **Annotations:**
* "24" is written near the top-left of the circle.
* "of" is written near the top-center of the circle.
* "b" is written near the right side of the circle.
* "21. Marty." is written near the bottom-left of the circle.
* "Marty." is likely an abbreviation for "Martii" (March in Latin).
* "berest.v." is written below "21. Marty."
* "6." is written near the bottom of the circle.
* **Dots:** Contains approximately seven dots, clustered mostly in the upper half of the circle.
### Key Observations
* The number of stars/objects varies significantly between the diagrams.
* The annotations suggest dates and potentially other observational parameters.
* The handwriting appears consistent across all annotations, suggesting a single observer.
### Interpretation
The image likely represents a series of astronomical observations recorded by hand. The diagrams depict the relative positions of stars or other celestial objects at different times. The annotations provide dates (e.g., March 21st) and potentially other observational details. The varying number of stars/objects in each diagram could reflect changes in the field of view, the visibility of certain objects, or actual changes in the observed region of the sky. The annotations "of" and "b" in the third diagram are unclear without further context, but they might refer to specific stars or features. The term "berest.v." is also unclear and may be a specific astronomical term or abbreviation used by the observer.