## Diagram: Three Annotated Circles with Scientific Notations
### Overview
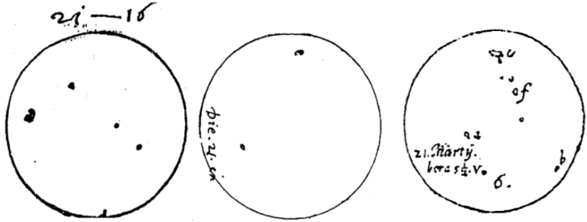
The image displays three hand-drawn circles arranged horizontally, each containing distinct textual annotations, symbols, and numerical values. The circles appear to represent observational or experimental data, with labels suggesting measurements, dates, and technical specifications.
### Components/Axes
- **Left Circle**:
- Label: "2i-16" (top-center, handwritten).
- Contents: Three black dots (unevenly spaced).
- **Middle Circle**:
- Label: "die.24. cm" (vertical text on the left edge).
- Contents: One central black dot.
- **Right Circle**:
- Labels:
- "90° of" (top-center, handwritten).
- "21. März." (lower-left, German for "21st of March").
- "vor 5½ V." (lower-left, German for "before 5.5 V.").
- "6." (lower-right, handwritten).
- Contents: Three black dots (one near the top-right, one near the center, one near the bottom).
### Detailed Analysis
- **Left Circle**:
- "2i-16" likely denotes a reference code or identifier (e.g., experiment ID, sample number).
- The three dots may represent discrete data points or measurements (e.g., positions, intensities).
- **Middle Circle**:
- "die.24. cm" translates to "the 24 cm" in German, possibly indicating a measurement of 24 cm (e.g., diameter, distance).
- The single dot could signify a central reference point or a singular observation.
- **Right Circle**:
- "90° of" suggests angular measurement (e.g., 90 degrees of rotation or observation).
- "21. März." (21st of March) implies a timestamp for the data.
- "vor 5½ V." ("before 5.5 V.") may reference a voltage threshold or experimental condition.
- "6." could denote a sequential step, phase, or category.
- The three dots might correlate with specific events or measurements tied to the annotations.
### Key Observations
1. **Temporal Context**: The date "21. März." anchors the data to March 21st, suggesting time-series relevance.
2. **Technical Specifications**: Voltage ("5½ V.") and angular measurements ("90°") indicate a physics or engineering context.
3. **Sequential Notation**: The number "6." in the right circle may imply a sixth iteration or phase in a process.
4. **Spatial Distribution**: Dots in the left and right circles are asymmetrically placed, possibly reflecting non-uniform observations.
### Interpretation
The diagram likely documents experimental observations or measurements, with each circle representing a distinct variable or condition:
- **Left Circle**: A reference-coded dataset ("2i-16") with three discrete measurements.
- **Middle Circle**: A 24 cm measurement, possibly geometric or spatial.
- **Right Circle**: Angular and temporal data ("90°," "21. März.") with voltage constraints ("vor 5½ V.") and a sequential marker ("6.").
The annotations suggest a structured investigation, where measurements are tied to specific dates, conditions, and reference codes. The asymmetry in dot placement may indicate variability or anomalies in the observed phenomena.