## Density Plot: Token Count and Turns Distribution
### Overview
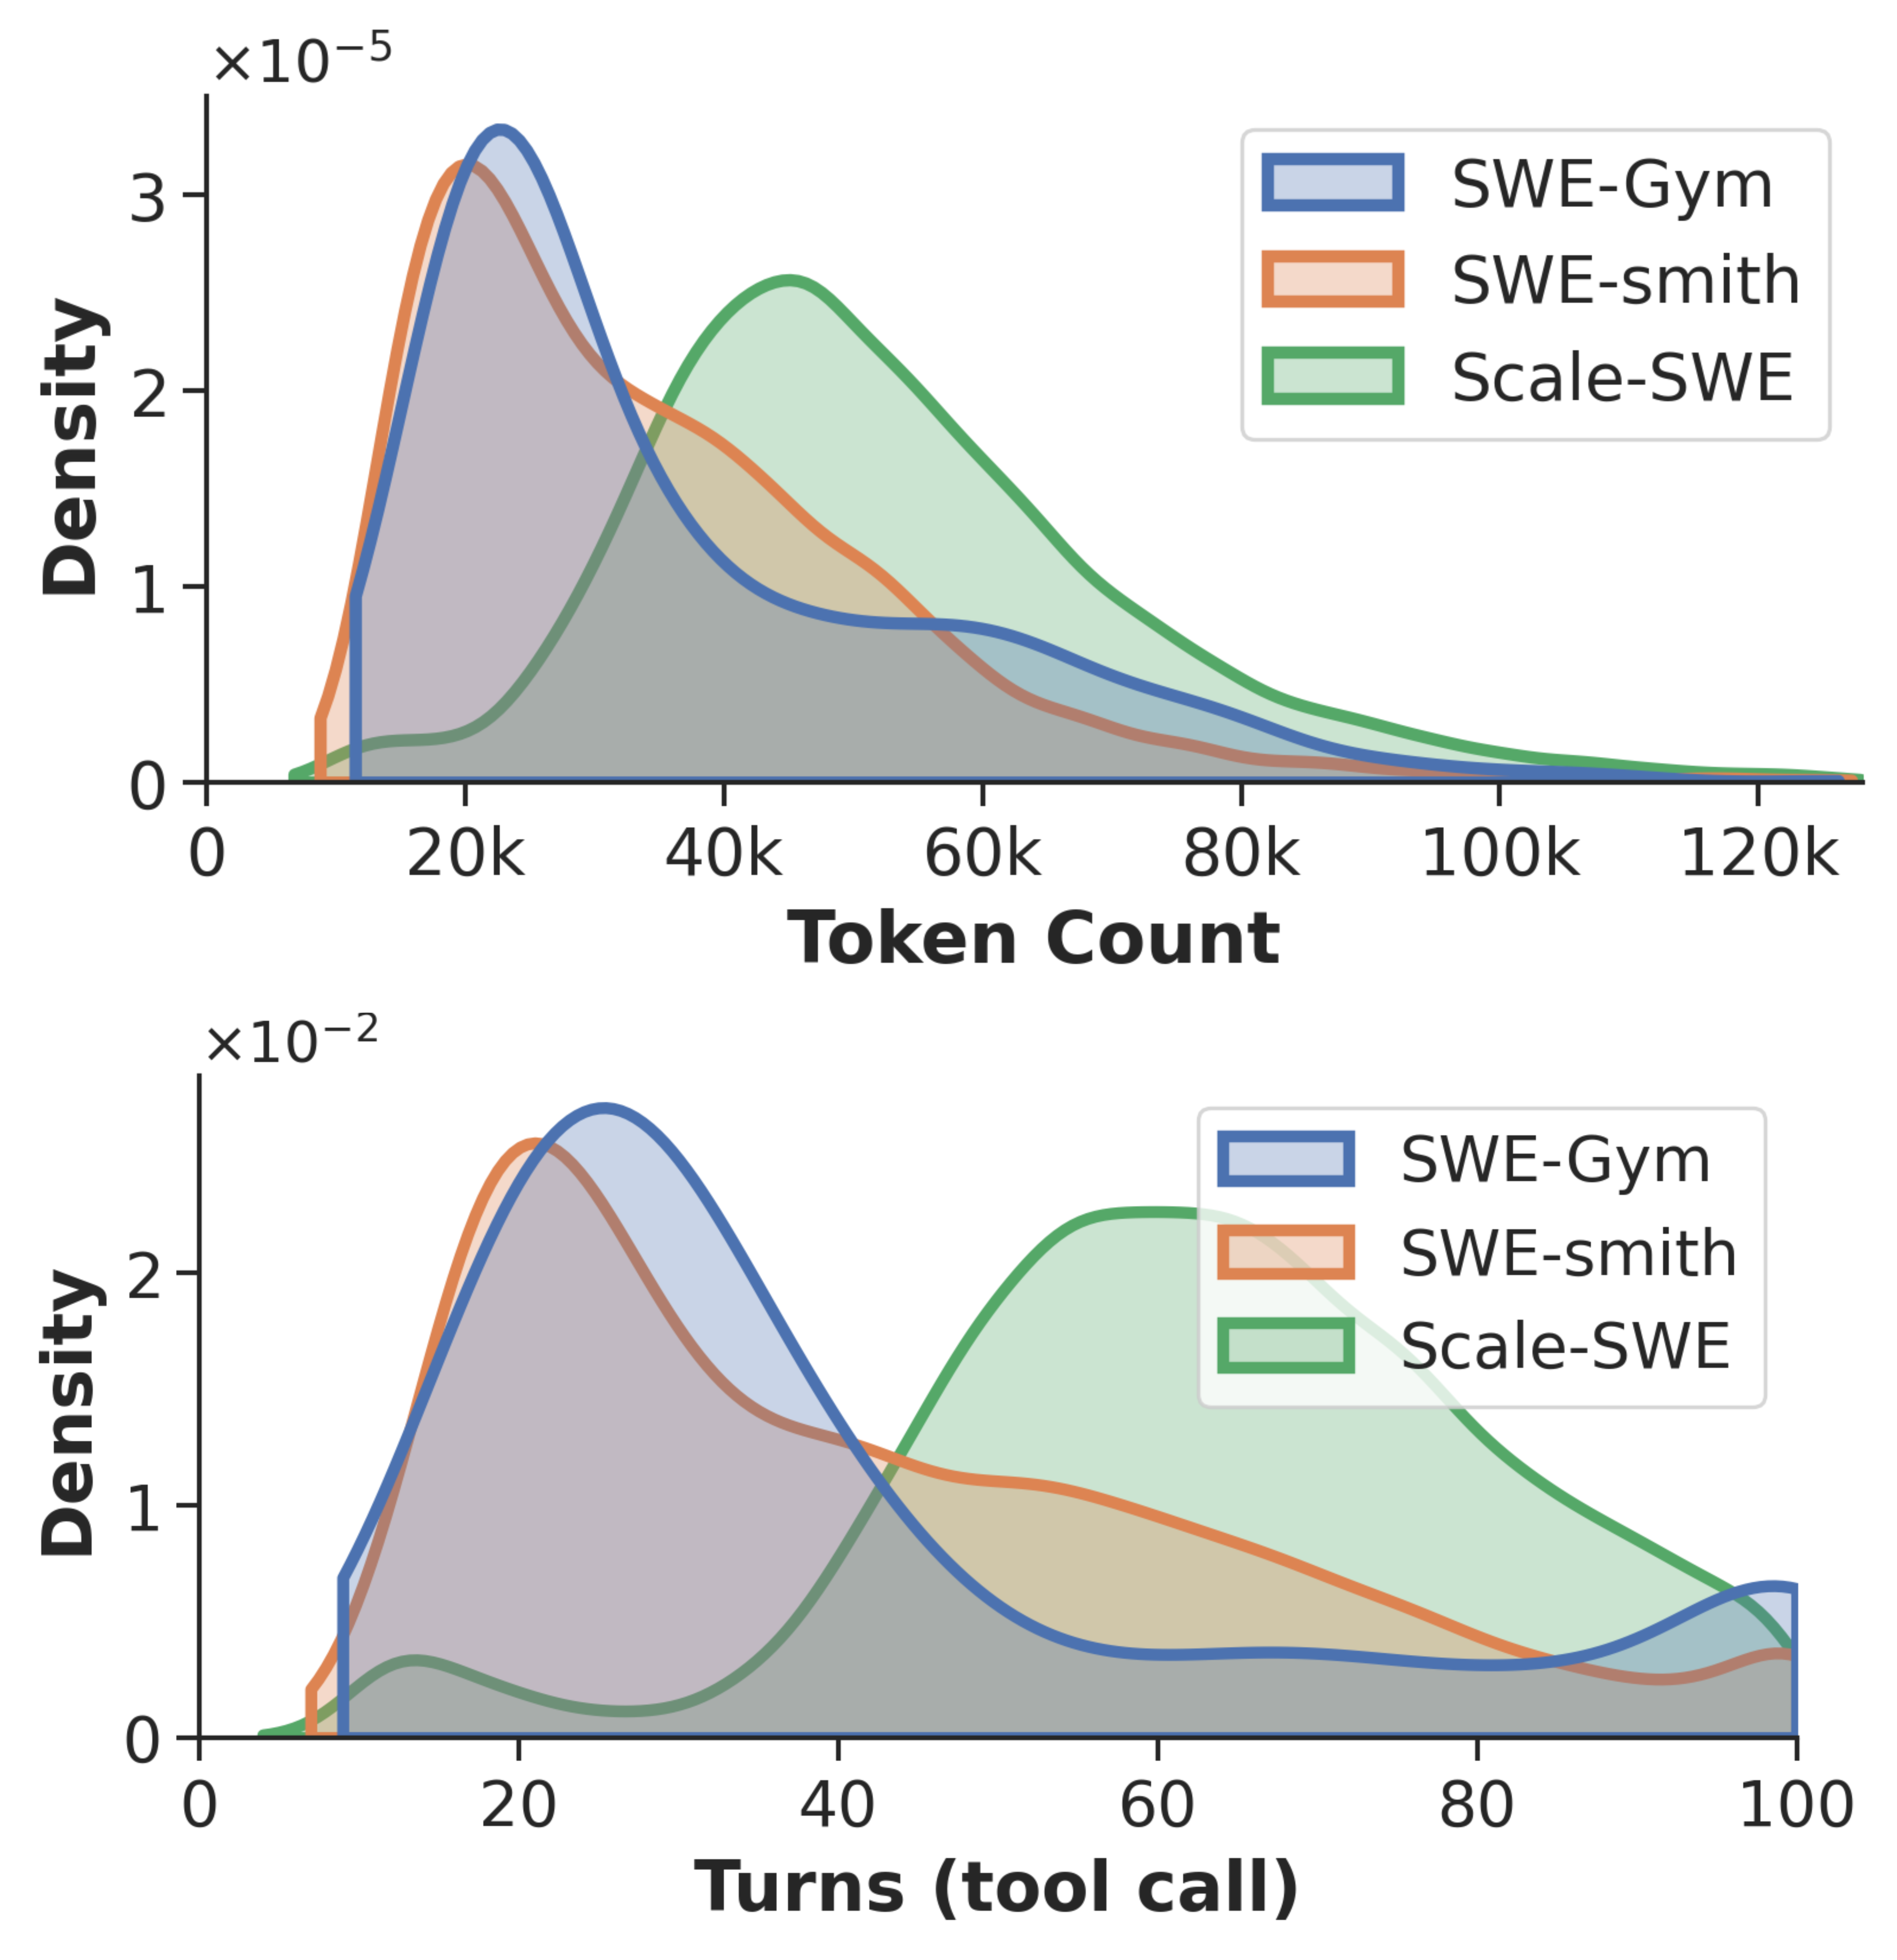
The image contains two density plots, one above the other. Both plots compare the distribution of three different datasets: "SWE-Gym", "SWE-smith", and "Scale-SWE". The top plot shows the density distribution with respect to "Token Count", while the bottom plot shows the density distribution with respect to "Turns (tool call)".
### Components/Axes
**Top Plot:**
* **Title:** Implicit, but represents density distribution of token count.
* **Y-axis:** "Density" with a scale factor of "x10^-5". The y-axis ranges from 0 to 3.
* **X-axis:** "Token Count" ranging from 0 to 120k.
* X-axis markers: 0, 20k, 40k, 60k, 80k, 100k, 120k
* **Legend:** Located in the top-right corner.
* SWE-Gym (Blue)
* SWE-smith (Orange)
* Scale-SWE (Green)
**Bottom Plot:**
* **Title:** Implicit, but represents density distribution of turns (tool call).
* **Y-axis:** "Density" with a scale factor of "x10^-2". The y-axis ranges from 0 to 2.
* **X-axis:** "Turns (tool call)" ranging from 0 to 100.
* X-axis markers: 0, 20, 40, 60, 80, 100
* **Legend:** Located in the top-right corner.
* SWE-Gym (Blue)
* SWE-smith (Orange)
* Scale-SWE (Green)
### Detailed Analysis
**Top Plot (Token Count):**
* **SWE-Gym (Blue):** The density rises sharply from 0 to a peak around 20k, then gradually decreases, extending to approximately 100k.
* Peak density: ~3.2 x 10^-5 at ~20k tokens
* **SWE-smith (Orange):** The density rises sharply from 0 to a peak around 20k, then decreases, extending to approximately 80k.
* Peak density: ~2.8 x 10^-5 at ~20k tokens
* **Scale-SWE (Green):** The density rises from 0 to a peak around 40k, then decreases, extending to approximately 120k.
* Peak density: ~2.5 x 10^-5 at ~40k tokens
**Bottom Plot (Turns):**
* **SWE-Gym (Blue):** The density rises sharply from 0 to a peak around 20, then decreases, extending to approximately 100.
* Peak density: ~2.3 x 10^-2 at ~20 turns
* **SWE-smith (Orange):** The density rises sharply from 0 to a peak around 20, then decreases, extending to approximately 80.
* Peak density: ~2.0 x 10^-2 at ~20 turns
* **Scale-SWE (Green):** The density rises from 0 to a peak around 55, then decreases, extending to approximately 100.
* Peak density: ~2.2 x 10^-2 at ~55 turns
### Key Observations
* In both plots, "SWE-Gym" and "SWE-smith" have similar distributions, peaking at lower values compared to "Scale-SWE".
* "Scale-SWE" has a broader distribution in both plots, indicating a wider range of token counts and turns.
* The density values are scaled differently in the two plots (10^-5 vs 10^-2), indicating different magnitudes of density.
### Interpretation
The plots compare the distributions of token counts and turns (tool calls) for three different datasets: SWE-Gym, SWE-smith, and Scale-SWE. The data suggests that SWE-Gym and SWE-smith have a tendency towards lower token counts and fewer turns compared to Scale-SWE. Scale-SWE exhibits a broader distribution, indicating more variability in both token counts and turns. This could imply that Scale-SWE involves more complex or varied interactions, leading to higher token counts and a greater number of tool calls. The difference in density scales between the two plots highlights that the density of turns is significantly higher than the density of token counts, after accounting for the scaling factors.