## Line Chart: Comparative Density Distributions of SWE Models
### Overview
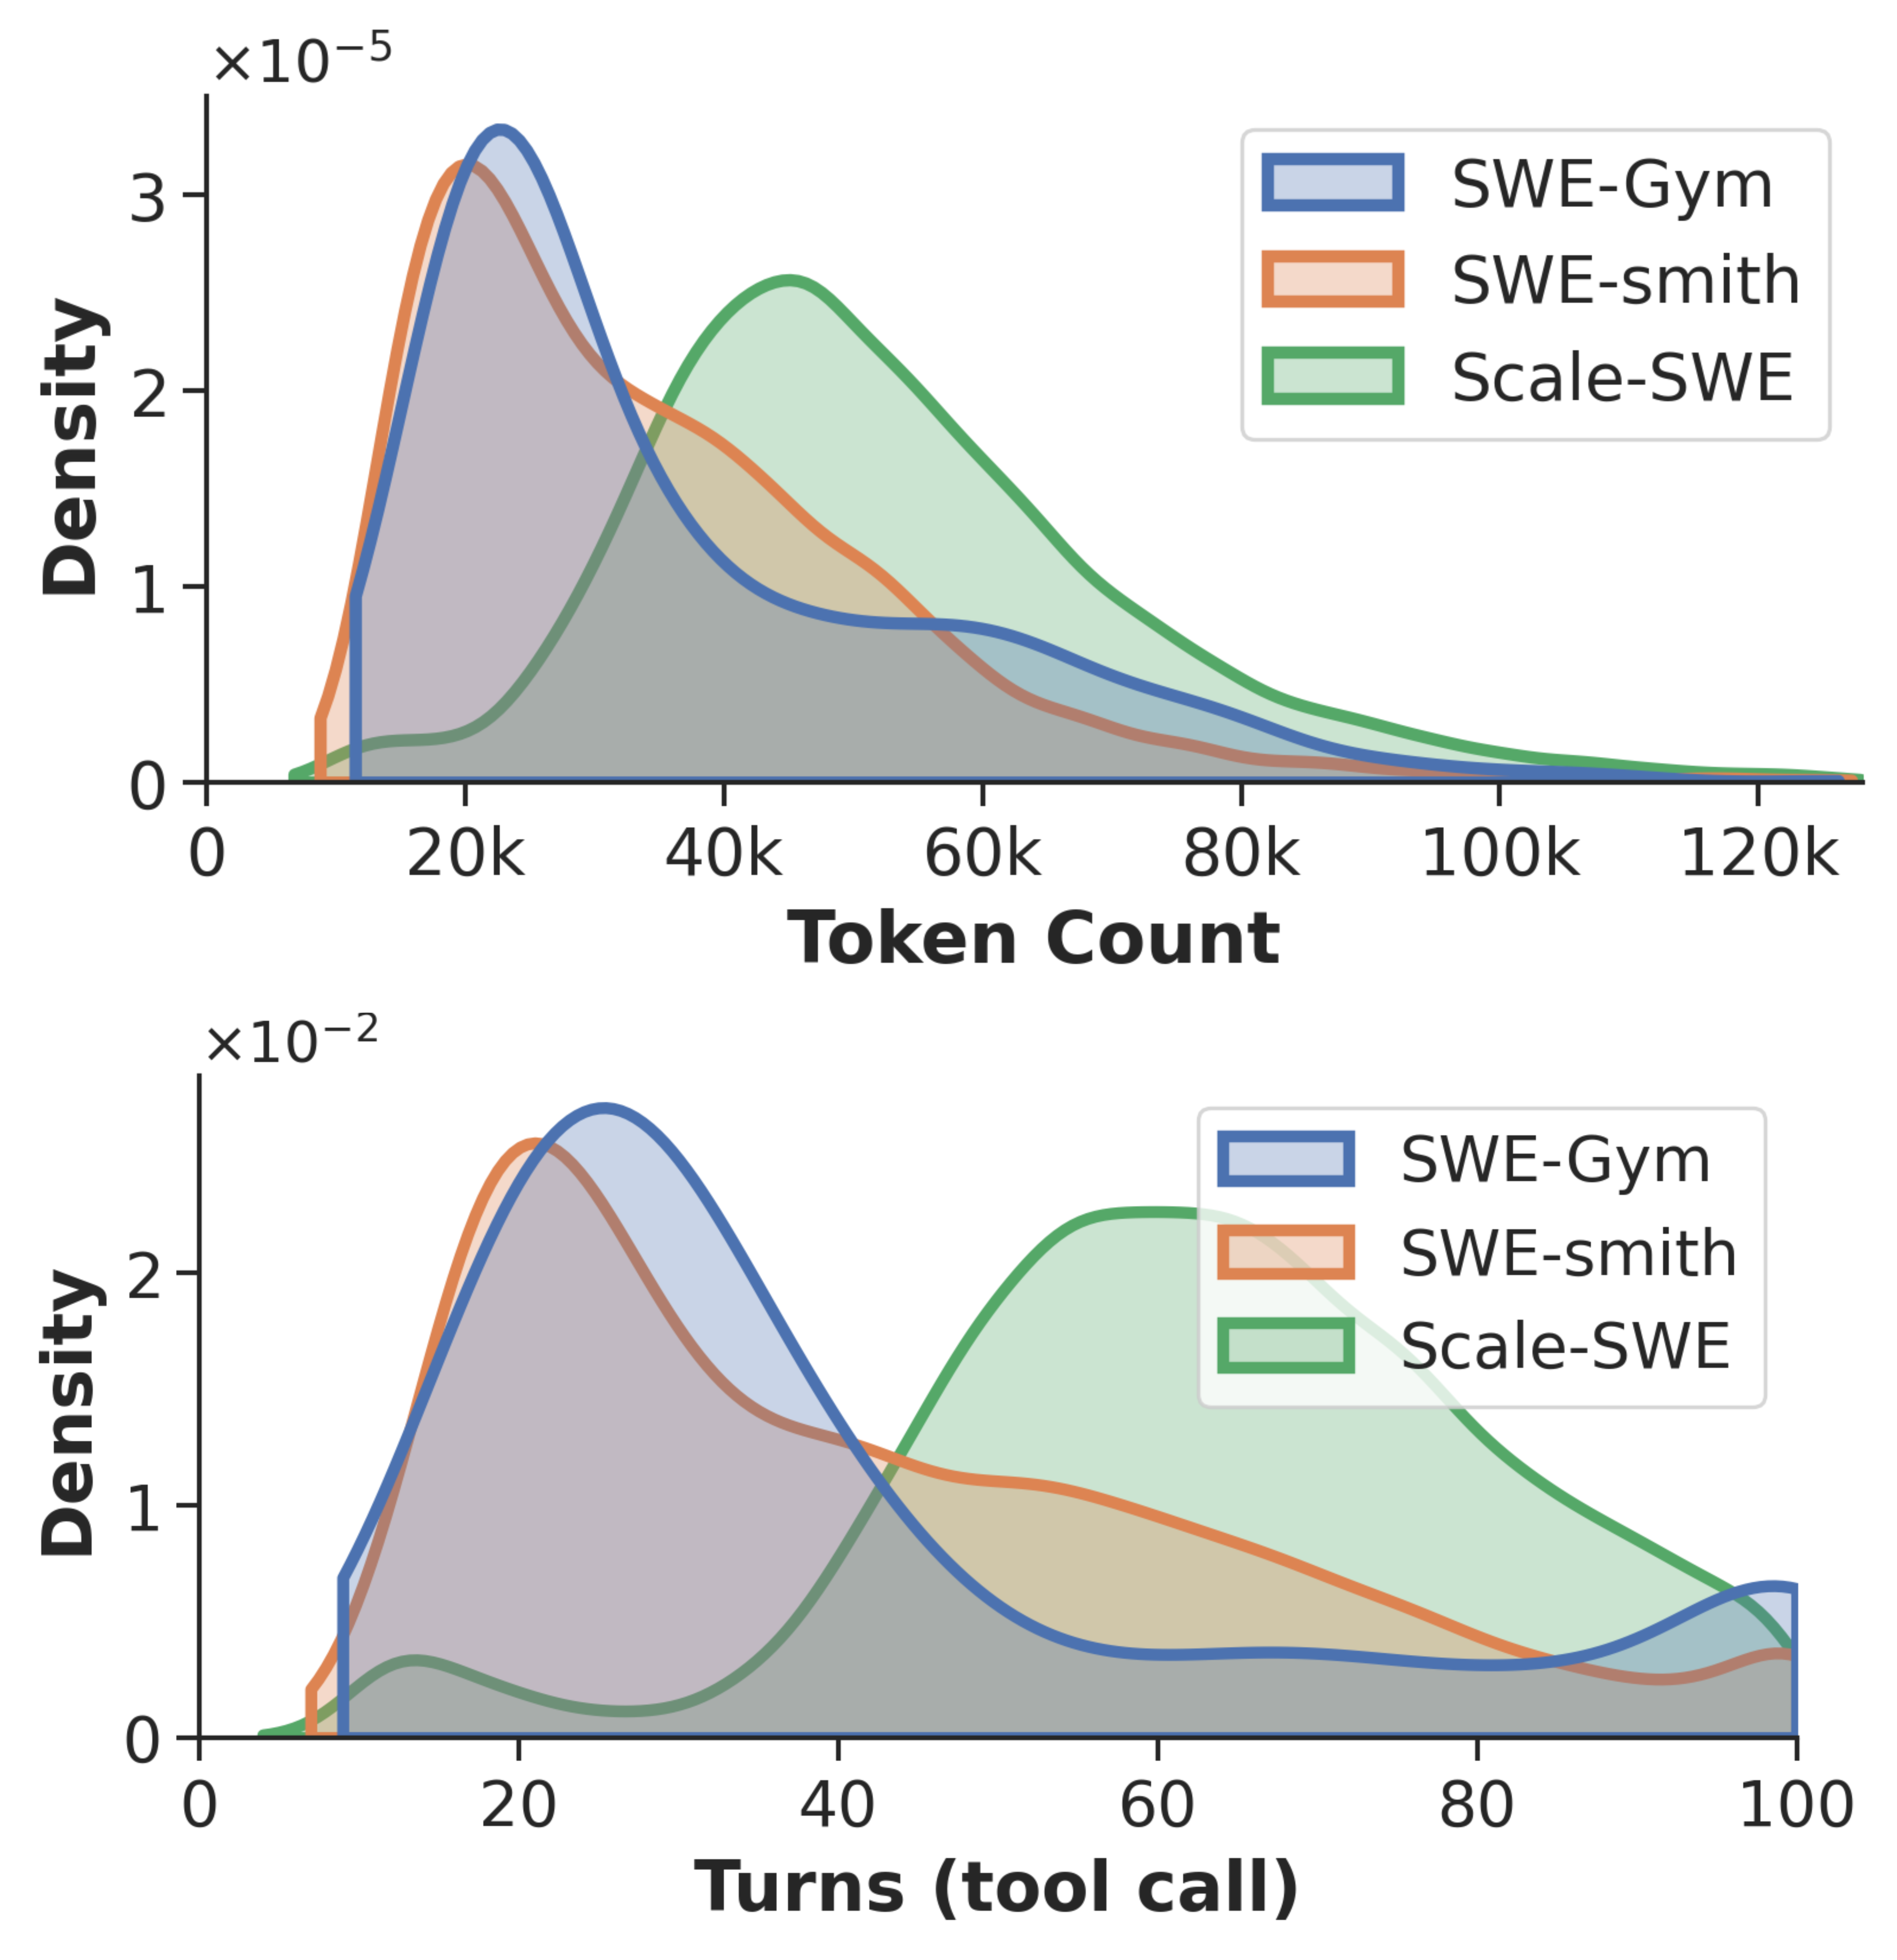
The image contains two overlaid density distribution charts comparing three software engineering workflow (SWE) models: SWE-Gym (blue), SWE-smith (orange), and Scale-SWE (green). The top subplot visualizes token count distributions, while the bottom subplot shows turn distributions (tool calls). Both charts use density curves with shaded areas representing probability distributions.
### Components/Axes
**Top Subplot (Token Count):**
- X-axis: Token Count (0 to 120k, linear scale)
- Y-axis: Density (0 to 3×10⁻⁵, linear scale)
- Legend: Top-right corner with color-coded labels
- Axis markers: Numerical ticks at 20k, 40k, 60k, 80k, 100k, 120k
**Bottom Subplot (Turns):**
- X-axis: Turns (tool call) (0 to 100, linear scale)
- Y-axis: Density (0 to 2×10⁻², linear scale)
- Legend: Same as top subplot
- Axis markers: Numerical ticks at 20, 40, 60, 80, 100
### Detailed Analysis
**Token Count Distribution:**
1. **SWE-Gym (blue):**
- Peak density at ~20k tokens (3.2×10⁻⁵)
- Sharp decline after peak, near-zero beyond 40k
- Narrowest distribution (σ ≈ 5k tokens)
2. **SWE-smith (orange):**
- Peak density at ~30k tokens (2.8×10⁻⁵)
- Broader distribution than SWE-Gym (σ ≈ 8k tokens)
- Longer tail extending to 60k tokens
3. **Scale-SWE (green):**
- Bimodal distribution with peaks at ~25k and ~50k tokens
- Highest overall density (3.5×10⁻⁵ at 50k)
- Widest distribution (σ ≈ 15k tokens)
**Turn Distribution:**
1. **SWE-Gym (blue):**
- Peak density at 20 turns (1.8×10⁻²)
- Rapid decline after peak, near-zero beyond 40 turns
- Narrowest distribution (σ ≈ 5 turns)
2. **SWE-smith (orange):**
- Peak density at 30 turns (1.6×10⁻²)
- Broader distribution than SWE-Gym (σ ≈ 7 turns)
- Longer tail extending to 60 turns
3. **Scale-SWE (green):**
- Bimodal distribution with peaks at ~25 and ~50 turns
- Highest overall density (2.0×10⁻² at 50 turns)
- Widest distribution (σ ≈ 12 turns)
### Key Observations
1. **Consistency vs. Complexity Tradeoff:**
- SWE-Gym shows the most consistent performance (narrowest distributions)
- Scale-SWE demonstrates highest complexity handling (widest distributions)
- SWE-smith represents intermediate behavior
2. **Bimodal Patterns:**
- Scale-SWE's bimodal distributions suggest two distinct operational modes
- Secondary peaks at ~50k tokens/turns indicate specialized task handling
3. **Scale Relationships:**
- Token count distributions are 100-1000x wider than turn distributions
- Density scales differ by 1000x between subplots (1e-5 vs 1e-2)
### Interpretation
The data reveals fundamental differences in model behavior:
- **SWE-Gym** prioritizes efficiency with minimal token/turn usage but limited complexity handling
- **Scale-SWE** sacrifices efficiency for broader capability, showing variable performance across task complexities
- **SWE-smith** balances these factors, offering moderate efficiency with improved complexity handling
The bimodal patterns in Scale-SWE suggest adaptive behavior, potentially switching between different processing strategies. The consistent peak positions across models (20-30k tokens/turns) indicate common operational thresholds in SWE workflows. The density scale differences emphasize that token distributions are inherently more variable than turn counts in these models.