## Diagram: MLE-Bench Workflow
### Overview
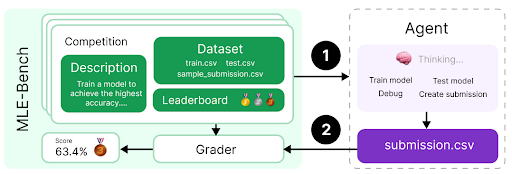
The image depicts a workflow diagram for MLE-Bench, illustrating the process from competition setup to agent submission and grading. It shows the flow of data and actions between different components, including the competition dataset, agent, grader, and submission file.
### Components/Axes
* **MLE-Bench:** Title of the workflow. Located on the left side of the diagram.
* **Competition:** A stack of cards representing the competition environment.
* **Description:** A green box within the "Competition" stack, containing the text "Train a model to achieve the highest accuracy...."
* **Dataset:** A green box within the "Competition" stack, listing the files "train.csv", "test.csv", and "sample\_submission.csv".
* **Leaderboard:** A section within the "Competition" stack, displaying gold, silver, and bronze medal icons.
* **Agent:** A box on the right side of the diagram, representing the agent that interacts with the competition.
* **Thinking...:** Text inside the agent box, accompanied by a brain icon.
* **Train model, Test model, Debug, Create submission:** Actions performed by the agent.
* **Grader:** A box at the bottom-left of the diagram, responsible for evaluating the agent's submission.
* **submission.csv:** A purple box at the bottom-right, representing the agent's submission file.
* **Score:** Located below the "Competition" stack, displaying the score "63.4%" and a bronze medal icon.
* **Arrows:** Two numbered arrows indicating the flow of data:
* Arrow 1: From the "Competition" stack to the "Agent".
* Arrow 2: From the "Agent" to "submission.csv" and then to the "Grader".
### Detailed Analysis or Content Details
* The workflow starts with the "Competition" environment, which includes a description of the task, the dataset files, and a leaderboard.
* The agent receives information from the competition (Arrow 1) and performs actions such as training, testing, debugging, and creating a submission.
* The agent submits a "submission.csv" file, which is then evaluated by the "Grader" (Arrow 2).
* The grader provides a score (63.4% with a bronze medal) based on the submission.
### Key Observations
* The diagram illustrates a typical machine learning competition workflow.
* The agent interacts with the competition environment, trains a model, and submits predictions.
* The grader evaluates the submission and provides a score.
### Interpretation
The diagram provides a high-level overview of the MLE-Bench workflow. It shows the key components involved in a machine learning competition, including the dataset, agent, and grader. The workflow emphasizes the iterative process of training, testing, and submitting models to achieve the highest accuracy. The score of 63.4% with a bronze medal indicates the agent's performance in the competition. The diagram highlights the importance of the agent's ability to effectively utilize the dataset and create a valid submission file.