\n
## Diagram: MLE-Bench Agent Workflow
### Overview
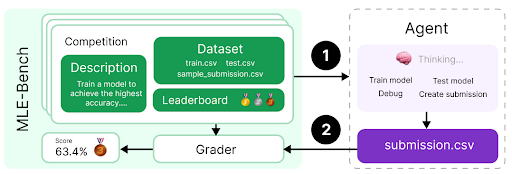
The image depicts a diagram illustrating the workflow of an agent interacting with the MLE-Bench environment. It shows the flow of information and actions between the agent, a competition setup (including dataset and leaderboard), and a grader. The diagram is structured to show a cyclical process of model training, submission, and evaluation.
### Components/Axes
The diagram consists of the following key components:
* **MLE-Bench (Left Side):** A rounded rectangle containing:
* **Competition Description:** A green rectangle with the text "Train a model to achieve the highest accuracy..."
* **Dataset:** A green rectangle with the following file names listed: "train.csv", "test.csv", "sample\_submission.csv".
* **Leaderboard:** A green rectangle with three trophy icons (gold, silver, bronze).
* **Grader:** A yellow rectangle displaying a score of "63.4%" and a trophy icon.
* **Agent (Right Side):** A dashed-border rectangle containing:
* **Thinking...:** A brain icon with the text "Thinking...".
* **Actions:** A white rectangle listing the following actions: "Train model", "Test model", "Debug", "Create submission".
* **submission.csv:** A purple rectangle labeled "submission.csv".
* **Flow Arrows:** Black arrows with numbered circles (1 and 2) indicating the direction of information flow.
### Detailed Analysis or Content Details
The diagram illustrates a two-step process:
1. **Step 1 (Arrow 1):** The MLE-Bench environment (specifically the Competition Description, Dataset, and Leaderboard) sends information to the Agent.
2. **Step 2 (Arrow 2):** The Agent sends a "submission.csv" file to the Grader.
The Grader then evaluates the submission and provides a score (63.4%) and a trophy icon. This score is displayed within the Grader component. The Agent's actions are listed as "Train model", "Test model", "Debug", and "Create submission", suggesting the agent iteratively improves its model based on the feedback from the Grader. The "Thinking..." icon suggests the agent is actively processing information.
### Key Observations
* The diagram emphasizes a closed-loop system where the agent learns from its submissions and refines its model.
* The specific file names within the Dataset component ("train.csv", "test.csv", "sample\_submission.csv") indicate a standard machine learning competition format.
* The leaderboard with trophy icons suggests a competitive aspect to the MLE-Bench environment.
* The score of 63.4% provides a concrete example of the Grader's output.
### Interpretation
The diagram represents a typical machine learning competition workflow. The MLE-Bench environment provides the data and evaluation framework, while the Agent represents an automated system (potentially a machine learning model or an AI agent) that attempts to achieve the highest accuracy on the given task. The iterative process of submission, grading, and model refinement is central to the workflow. The diagram suggests that MLE-Bench is designed to facilitate the development and evaluation of machine learning agents in a competitive setting. The numbered arrows highlight the sequential nature of the process, and the inclusion of actions like "Debug" indicates the importance of iterative development and troubleshooting. The "Thinking..." icon suggests a level of autonomy and intelligence within the Agent.