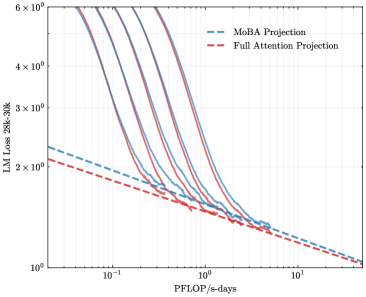
## Chart: LM Loss vs. PFLOP/s-days
### Overview
The image is a line chart comparing the Language Model (LM) Loss of two different projection methods, MoBA Projection and Full Attention Projection, against the computational cost measured in PFLOP/s-days. The chart displays multiple runs for each method, showing the variability in performance.
### Components/Axes
* **X-axis:** PFLOP/s-days (PetaFLOPS per second-days), ranging from approximately 0.05 to 10.
* **Y-axis:** LM Loss (Language Model Loss) for the range 28k-30k, ranging from 1 x 10^0 to 6 x 10^0 (logarithmic scale).
* **Legend (top-left):**
* Blue dashed line: MoBA Projection
* Red dashed line: Full Attention Projection
### Detailed Analysis
* **MoBA Projection (Blue dashed line):**
* The MoBA Projection line starts at approximately 2.3 x 10^0 LM Loss at 0.05 PFLOP/s-days and decreases to approximately 1.1 x 10^0 LM Loss at 10 PFLOP/s-days.
* **Full Attention Projection (Red dashed line):**
* The Full Attention Projection line starts at approximately 2.1 x 10^0 LM Loss at 0.05 PFLOP/s-days and decreases to approximately 1.2 x 10^0 LM Loss at 10 PFLOP/s-days.
* **Multiple Runs (Solid Lines):**
* There are multiple solid blue and red lines, representing different runs of the MoBA Projection and Full Attention Projection, respectively.
* The solid lines start at approximately 6 x 10^0 LM Loss at 0.05 PFLOP/s-days and decrease to approximately 1.3 x 10^0 LM Loss at 10 PFLOP/s-days.
* The solid lines show a steeper initial decrease in LM Loss compared to the dashed lines.
* The solid lines converge towards the dashed lines as the PFLOP/s-days increase.
### Key Observations
* The LM Loss decreases as the computational cost (PFLOP/s-days) increases for both projection methods.
* The multiple runs (solid lines) show variability in performance, especially at lower computational costs.
* The MoBA Projection and Full Attention Projection (dashed lines) have similar performance, with the Full Attention Projection slightly outperforming the MoBA Projection.
### Interpretation
The chart demonstrates the relationship between computational cost and language model loss for two different projection methods. The decreasing LM Loss with increasing PFLOP/s-days indicates that more computation leads to better model performance. The multiple runs highlight the importance of considering variability in performance when evaluating these methods. The similarity in performance between MoBA Projection and Full Attention Projection suggests that both methods are viable options, and the choice between them may depend on other factors such as implementation complexity or specific hardware constraints. The convergence of the solid lines towards the dashed lines suggests that the initial variability in performance decreases as the computational cost increases.