## Line Chart: LM Loss vs. PFLOP/s-days
### Overview
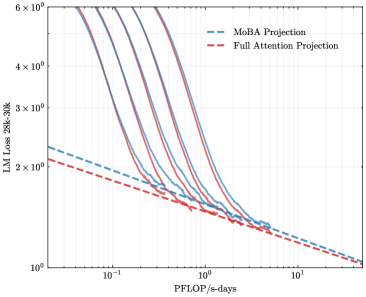
This image presents a line chart comparing the Language Model (LM) Loss of two projection methods – MoBA Projection and Full Attention Projection – as a function of PFLOP/s-days (floating point operations per second per day). Multiple lines are shown for each projection method, likely representing different runs or configurations. The chart uses a logarithmic scale for both the y-axis (LM Loss) and the x-axis (PFLOP/s-days).
### Components/Axes
* **X-axis:** PFLOP/s-days, ranging from approximately 10<sup>-2</sup> to 10<sup>1</sup> (0.01 to 10). The scale is logarithmic.
* **Y-axis:** LM Loss 28k-30k, ranging from approximately 10<sup>0</sup> to 10<sup>6</sup> (1 to 1,000,000). The scale is logarithmic.
* **Legend:** Located in the top-right corner.
* MoBA Projection (Blue dashed lines)
* Full Attention Projection (Red solid lines)
* **Data Series:** Multiple lines for each projection method. There are approximately 6 lines for each method.
### Detailed Analysis
**MoBA Projection (Blue dashed lines):**
The MoBA Projection lines generally slope downward, indicating that as PFLOP/s-days increase, the LM Loss decreases.
* Line 1: Starts at approximately LM Loss = 2.5 x 10<sup>2</sup> (250) at PFLOP/s-days = 10<sup>-2</sup> (0.01), and decreases to approximately LM Loss = 2 x 10<sup>0</sup> (2) at PFLOP/s-days = 10<sup>1</sup> (10).
* Line 2: Starts at approximately LM Loss = 2 x 10<sup>2</sup> (200) at PFLOP/s-days = 10<sup>-2</sup> (0.01), and decreases to approximately LM Loss = 1.5 x 10<sup>0</sup> (1.5) at PFLOP/s-days = 10<sup>1</sup> (10).
* Line 3: Starts at approximately LM Loss = 1.5 x 10<sup>2</sup> (150) at PFLOP/s-days = 10<sup>-2</sup> (0.01), and decreases to approximately LM Loss = 1 x 10<sup>0</sup> (1) at PFLOP/s-days = 10<sup>1</sup> (10).
* Line 4: Starts at approximately LM Loss = 1 x 10<sup>2</sup> (100) at PFLOP/s-days = 10<sup>-2</sup> (0.01), and decreases to approximately LM Loss = 7 x 10<sup>-1</sup> (0.7) at PFLOP/s-days = 10<sup>1</sup> (10).
* Line 5: Starts at approximately LM Loss = 7 x 10<sup>1</sup> (70) at PFLOP/s-days = 10<sup>-2</sup> (0.01), and decreases to approximately LM Loss = 5 x 10<sup>-1</sup> (0.5) at PFLOP/s-days = 10<sup>1</sup> (10).
* Line 6: Starts at approximately LM Loss = 5 x 10<sup>1</sup> (50) at PFLOP/s-days = 10<sup>-2</sup> (0.01), and decreases to approximately LM Loss = 3 x 10<sup>-1</sup> (0.3) at PFLOP/s-days = 10<sup>1</sup> (10).
**Full Attention Projection (Red solid lines):**
The Full Attention Projection lines also slope downward, but generally start at a higher LM Loss and decrease more rapidly than the MoBA Projection lines.
* Line 1: Starts at approximately LM Loss = 5 x 10<sup>3</sup> (5000) at PFLOP/s-days = 10<sup>-2</sup> (0.01), and decreases to approximately LM Loss = 2 x 10<sup>0</sup> (2) at PFLOP/s-days = 10<sup>1</sup> (10).
* Line 2: Starts at approximately LM Loss = 4 x 10<sup>3</sup> (4000) at PFLOP/s-days = 10<sup>-2</sup> (0.01), and decreases to approximately LM Loss = 1.5 x 10<sup>0</sup> (1.5) at PFLOP/s-days = 10<sup>1</sup> (10).
* Line 3: Starts at approximately LM Loss = 3 x 10<sup>3</sup> (3000) at PFLOP/s-days = 10<sup>-2</sup> (0.01), and decreases to approximately LM Loss = 1 x 10<sup>0</sup> (1) at PFLOP/s-days = 10<sup>1</sup> (10).
* Line 4: Starts at approximately LM Loss = 2 x 10<sup>3</sup> (2000) at PFLOP/s-days = 10<sup>-2</sup> (0.01), and decreases to approximately LM Loss = 7 x 10<sup>-1</sup> (0.7) at PFLOP/s-days = 10<sup>1</sup> (10).
* Line 5: Starts at approximately LM Loss = 1.5 x 10<sup>3</sup> (1500) at PFLOP/s-days = 10<sup>-2</sup> (0.01), and decreases to approximately LM Loss = 5 x 10<sup>-1</sup> (0.5) at PFLOP/s-days = 10<sup>1</sup> (10).
* Line 6: Starts at approximately LM Loss = 1 x 10<sup>3</sup> (1000) at PFLOP/s-days = 10<sup>-2</sup> (0.01), and decreases to approximately LM Loss = 3 x 10<sup>-1</sup> (0.3) at PFLOP/s-days = 10<sup>1</sup> (10).
### Key Observations
* The Full Attention Projection consistently exhibits higher LM Loss values than the MoBA Projection across the entire range of PFLOP/s-days.
* Both projection methods demonstrate diminishing returns in loss reduction as PFLOP/s-days increase. The rate of loss decrease slows down at higher PFLOP/s-days values.
* The multiple lines for each projection method suggest variability in performance, potentially due to different initialization conditions, hyperparameters, or data subsets.
### Interpretation
The chart demonstrates the trade-off between computational cost (PFLOP/s-days) and model performance (LM Loss) for two different projection methods. The Full Attention Projection, while achieving lower loss values at higher computational costs, is significantly more expensive than the MoBA Projection. The MoBA Projection offers a more efficient approach to reducing LM Loss, albeit at a slightly higher loss value for a given computational budget. The variability between lines within each projection method suggests that the performance is not deterministic and may be sensitive to various factors. This data suggests that MoBA Projection is a more efficient method for reducing LM Loss, but Full Attention Projection can achieve lower loss values if computational resources are not a constraint. The logarithmic scales highlight the rapid initial improvement in loss reduction followed by diminishing returns, indicating a point of saturation where further increases in PFLOP/s-days yield minimal performance gains.