\n
## Line Chart: LLM Training Loss vs. Computational Resources
### Overview
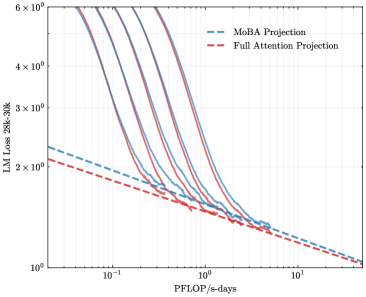
The image is a log-log line chart comparing the projected training loss of two different Large Language Model (LLM) architectures—MoBA (Mixture of Block Attention) and Full Attention—against the computational budget measured in PFLOP/s-days. The chart also includes several unlabeled solid lines, likely representing empirical training runs or alternative scaling laws.
### Components/Axes
* **Chart Type:** Log-Log Line Chart.
* **X-Axis:**
* **Label:** `PFLOP/s-days`
* **Scale:** Logarithmic (base 10).
* **Tick Marks:** Major ticks at `10^-1` (0.1), `10^0` (1), and `10^1` (10). The axis extends from approximately 0.05 to 20 PFLOP/s-days.
* **Y-Axis:**
* **Label:** `LLM Loss 20B-30B`
* **Scale:** Logarithmic (base 10).
* **Tick Marks:** Major ticks at `10^0` (1), `2×10^0` (2), `3×10^0` (3), `4×10^0` (4), and `6×10^0` (6). The axis extends from 1 to approximately 7.
* **Legend:**
* **Position:** Top-right corner of the plot area.
* **Entries:**
1. `MoBA Projection` - Represented by a blue dashed line (`--`).
2. `Full Attention Projection` - Represented by a red dashed line (`--`).
* **Data Series:**
1. **MoBA Projection (Blue Dashed Line):** A straight line on the log-log plot, indicating a power-law relationship. It starts at approximately (0.05 PFLOP/s-days, 2.3 Loss) and ends near (20 PFLOP/s-days, 1.0 Loss).
2. **Full Attention Projection (Red Dashed Line):** A straight line parallel to and slightly below the MoBA line. It starts at approximately (0.05 PFLOP/s-days, 2.1 Loss) and ends near (20 PFLOP/s-days, 1.0 Loss).
3. **Unlabeled Solid Lines (Multiple Colors):** A family of 5-6 solid lines in various colors (e.g., purple, teal, brown). They are not identified in the legend. These lines exhibit a steep, curved decline at lower compute budgets (left side) and converge to a shallower slope at higher compute budgets (right side), eventually aligning with the trajectory of the dashed projection lines.
### Detailed Analysis
* **Trend Verification:**
* **Projection Lines (Dashed):** Both the MoBA and Full Attention projections show a consistent, linear downward slope on the log-log scale. This visually confirms a power-law scaling: Loss ∝ (Compute)^-α, where α is the slope. The Full Attention line is consistently below the MoBA line, indicating a lower projected loss for the same compute budget.
* **Empirical/Alternative Lines (Solid):** These lines show a "knee" or bend. They descend very steeply for compute values less than ~1 PFLOP/s-days, suggesting rapid initial improvement. Beyond ~1 PFLOP/s-days, their slope flattens and begins to parallel the projection lines.
* **Data Point Approximation (Key Intersections):**
* At **0.1 PFLOP/s-days**:
* MoBA Projection: ~1.9 Loss
* Full Attention Projection: ~1.8 Loss
* Solid Lines: Range from ~2.5 to 4.0 Loss.
* At **1 PFLOP/s-days**:
* MoBA Projection: ~1.4 Loss
* Full Attention Projection: ~1.35 Loss
* Solid Lines: Converge to a narrow band between ~1.4 and 1.6 Loss.
* At **10 PFLOP/s-days**:
* MoBA Projection: ~1.1 Loss
* Full Attention Projection: ~1.05 Loss
* Solid Lines: Align closely with the projection lines, between ~1.05 and 1.15 Loss.
### Key Observations
1. **Projection vs. Empirical Behavior:** The dashed projection lines represent idealized power-law scaling. The solid lines, likely representing actual model training curves or a different scaling law, show that initial loss reduction is much faster than the long-term projection predicts, but they eventually converge to the projected scaling trend.
2. **Architectural Efficiency:** The Full Attention projection line is consistently below the MoBA projection line across the entire compute range shown. This suggests that, according to this model, Full Attention is predicted to be more compute-efficient (achieving lower loss for the same PFLOP/s-days) than MoBA for models in the 20B-30B parameter range.
3. **Convergence Point:** The family of solid lines appears to converge and merge with the projection lines in the region of **1 to 10 PFLOP/s-days**. This may indicate a transition point where the scaling behavior stabilizes into the predicted power law.
4. **Log-Log Linearity:** The straightness of the dashed lines on the log-log plot is a classic signature of a power-law relationship, a common finding in neural scaling laws.
### Interpretation
This chart is a technical comparison of scaling efficiency for two LLM attention mechanisms. The core message is twofold:
1. **Validation of Scaling Laws:** The convergence of the solid (empirical) lines onto the dashed (projected) lines at higher compute budgets visually validates the power-law scaling hypothesis for these architectures. It suggests that after an initial "warm-up" phase of rapid gain, model improvement follows a predictable, diminishing-returns trajectory relative to computational investment.
2. **Relative Architectural Performance:** The data suggests a performance hierarchy. For a given, fixed computational budget (PFLOP/s-days), the **Full Attention architecture is projected to yield a lower loss** than the MoBA architecture. This implies that, within the constraints of this analysis, the potential efficiency gains of a sparse attention mechanism like MoBA do not translate to lower loss compared to dense Full Attention when scaled to this model size (20B-30B parameters). The choice between them would therefore depend on other factors not shown here, such as inference speed, memory footprint, or performance on specific tasks.
**Uncertainty Note:** All numerical values are approximate, read from a log-scale chart. The exact values of the unlabeled solid lines cannot be determined without their corresponding legend keys. The title "LLM Loss 20B-30B" implies the data is specific to models within that parameter count range.