## Bar Chart: Number of Lean Calls by Method
### Overview
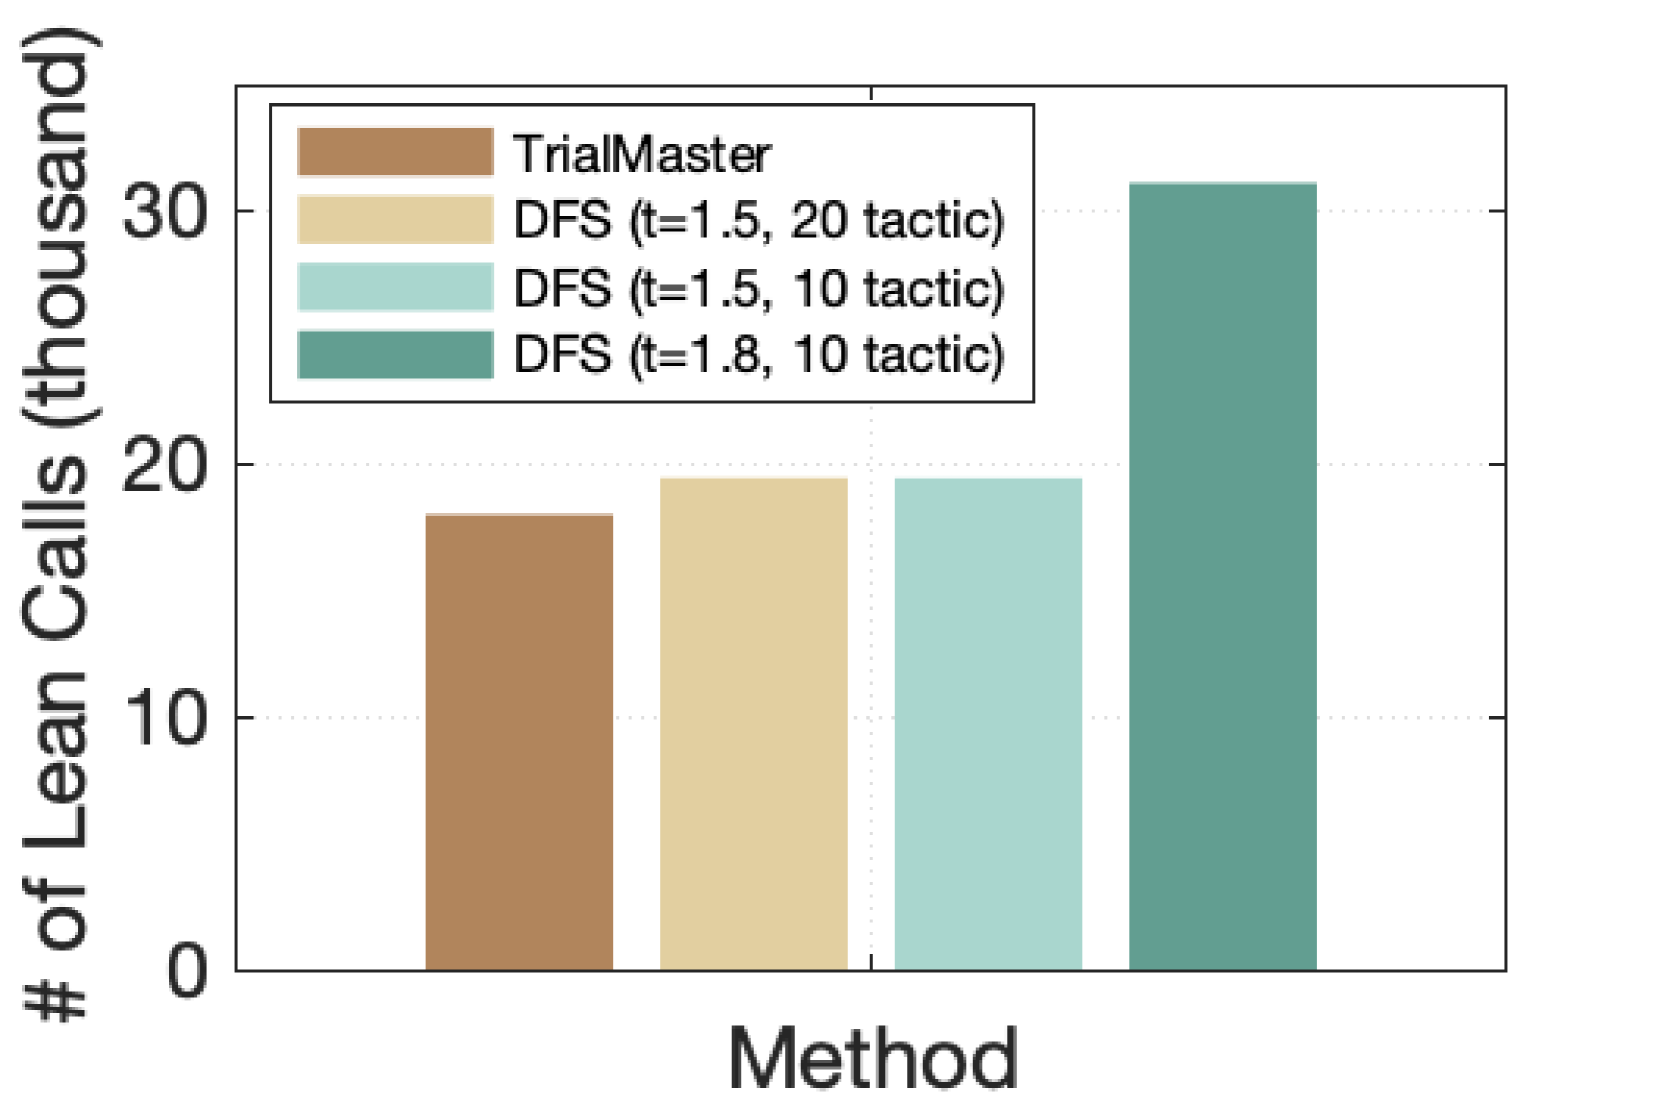
The chart compares the number of lean calls (in thousands) across four methods: TrialMaster and three variations of DFS (Dynamic Filtering System) with different parameters. The y-axis represents the count of lean calls, while the x-axis lists the methods. The tallest bar corresponds to the DFS method with t=1.8 and 10 tactics, indicating it generates the most lean calls.
### Components/Axes
- **X-axis (Method)**:
- TrialMaster (brown bar)
- DFS (t=1.5, 20 tactic) (light yellow bar)
- DFS (t=1.5, 10 tactic) (light blue bar)
- DFS (t=1.8, 10 tactic) (teal bar)
- **Y-axis (# of Lean Calls)**:
- Scale: 0 to 30 (thousand), with increments of 10.
- Labels: "0", "10", "20", "30".
- **Legend**:
- Positioned in the top-left corner, matching bar colors to method names.
- Colors:
- Brown: TrialMaster
- Light yellow: DFS (t=1.5, 20 tactic)
- Light blue: DFS (t=1.5, 10 tactic)
- Teal: DFS (t=1.8, 10 tactic)
### Detailed Analysis
- **TrialMaster**:
- Bar height ≈ 18,000 lean calls.
- Shortest bar, indicating the lowest lean call volume.
- **DFS (t=1.5, 20 tactic)**:
- Bar height ≈ 19,500 lean calls.
- Slightly taller than TrialMaster.
- **DFS (t=1.5, 10 tactic)**:
- Bar height ≈ 19,500 lean calls.
- Matches the previous DFS variant in height.
- **DFS (t=1.8, 10 tactic)**:
- Bar height ≈ 31,000 lean calls.
- Tallest bar, nearly double the others.
### Key Observations
1. **Dominance of DFS (t=1.8, 10 tactic)**: This method generates significantly more lean calls (~31k) compared to others (~18–19.5k).
2. **Similarity in DFS Variants**: The two DFS methods with t=1.5 (20 and 10 tactics) produce nearly identical results.
3. **TrialMaster Underperformance**: TrialMaster lags behind all DFS variants by ~1,500–3,000 calls.
### Interpretation
The data suggests that the DFS method with a higher threshold (t=1.8) and fewer tactics (10) is the most effective at generating lean calls, potentially due to stricter filtering or higher sensitivity. The similarity between DFS variants with t=1.5 implies that the number of tactics (10 vs. 20) has minimal impact when the threshold remains constant. TrialMaster’s lower performance may indicate inefficiency or design differences compared to DFS. The outlier (DFS t=1.8) warrants further investigation into why increased thresholds correlate with higher call volumes.