## Bar Chart: Lean Calls by Method
### Overview
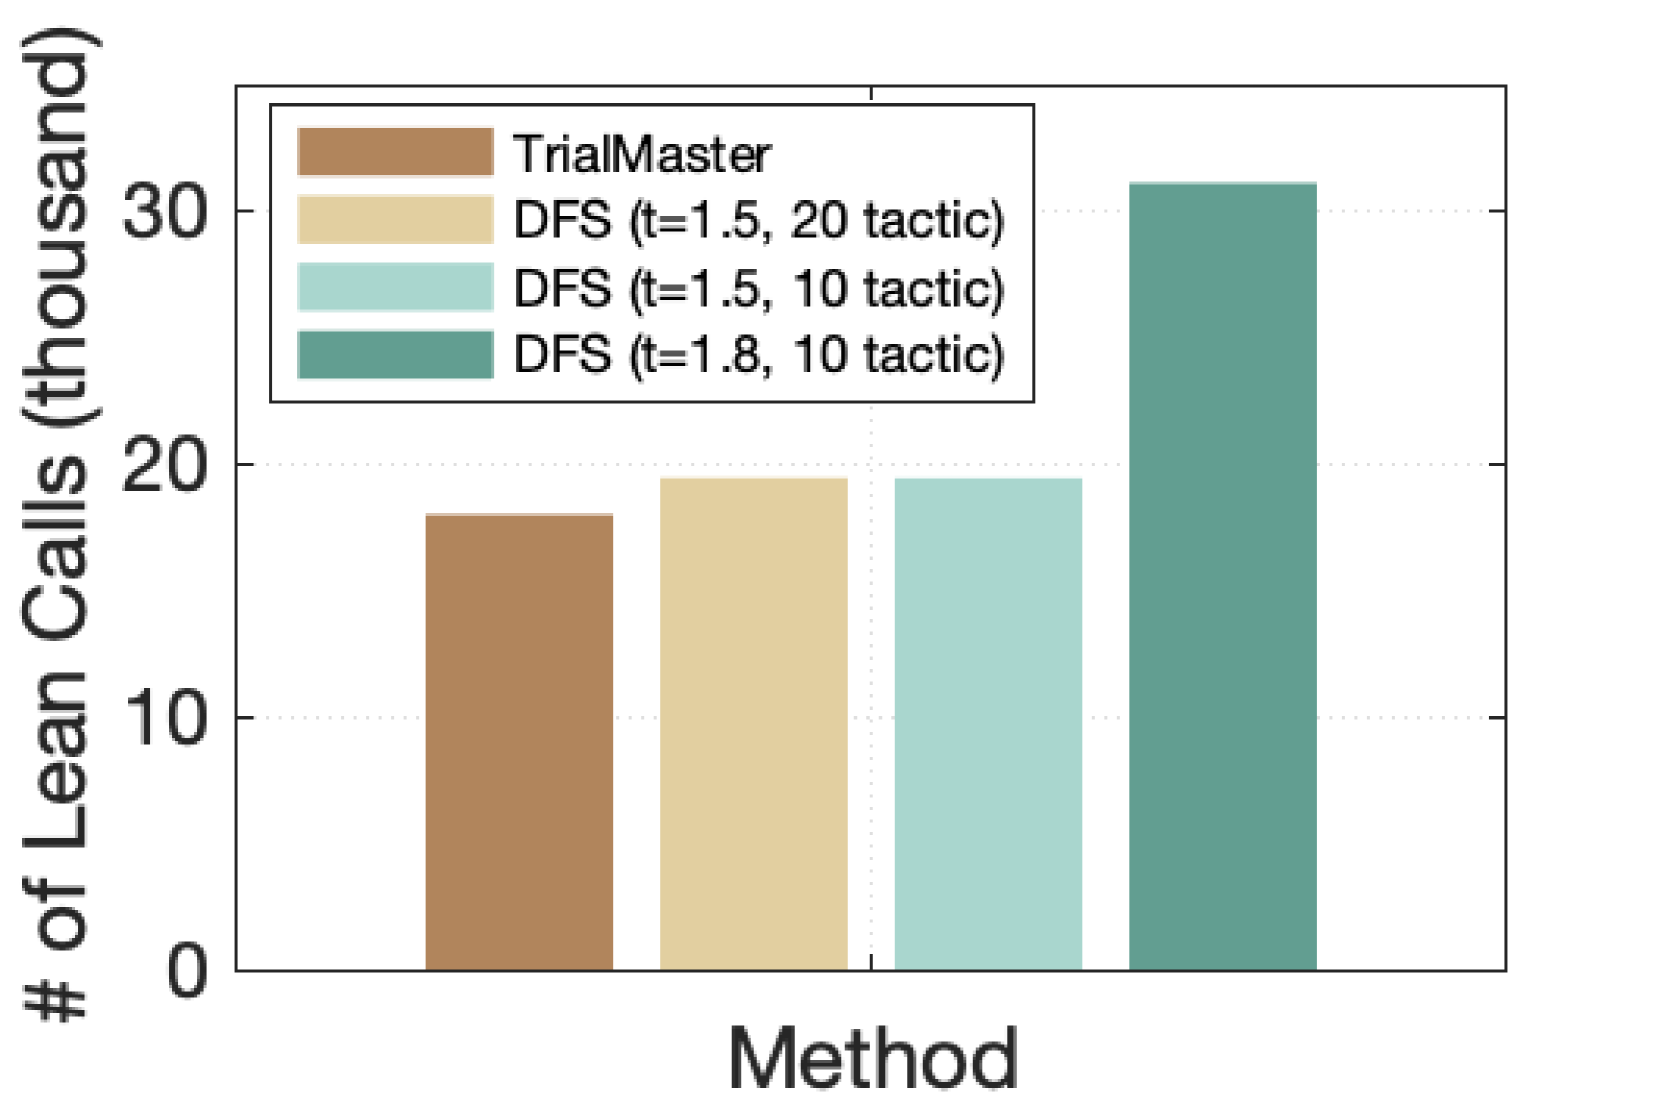
The image is a bar chart comparing the number of Lean calls (in thousands) for different methods: TrialMaster, DFS (t=1.5, 20 tactic), DFS (t=1.5, 10 tactic), and DFS (t=1.8, 10 tactic). The chart displays the relative performance of these methods in terms of the number of Lean calls required.
### Components/Axes
* **X-axis:** "Method" - Categorical axis representing the different methods being compared.
* **Y-axis:** "# of Lean Calls (thousand)" - Numerical axis representing the number of Lean calls, scaled in thousands. The axis ranges from 0 to 30, with gridlines at intervals of 10.
* **Legend:** Located in the top-left corner, the legend maps the colors of the bars to the corresponding methods:
* TrialMaster (brown)
* DFS (t=1.5, 20 tactic) (light tan)
* DFS (t=1.5, 10 tactic) (light blue)
* DFS (t=1.8, 10 tactic) (teal)
### Detailed Analysis
* **TrialMaster:** The brown bar representing TrialMaster reaches approximately 18 thousand Lean calls.
* **DFS (t=1.5, 20 tactic):** The light tan bar representing DFS (t=1.5, 20 tactic) reaches approximately 20 thousand Lean calls.
* **DFS (t=1.5, 10 tactic):** The light blue bar representing DFS (t=1.5, 10 tactic) reaches approximately 20 thousand Lean calls.
* **DFS (t=1.8, 10 tactic):** The teal bar representing DFS (t=1.8, 10 tactic) reaches approximately 31 thousand Lean calls.
### Key Observations
* TrialMaster has the lowest number of Lean calls among the methods compared.
* DFS (t=1.8, 10 tactic) has the highest number of Lean calls, significantly more than the other methods.
* DFS (t=1.5, 20 tactic) and DFS (t=1.5, 10 tactic) have approximately the same number of Lean calls.
### Interpretation
The bar chart suggests that the choice of method significantly impacts the number of Lean calls required. TrialMaster appears to be the most efficient method in terms of Lean calls, while DFS (t=1.8, 10 tactic) is the least efficient. The difference in 't' values and tactic numbers in the DFS methods seems to influence the number of Lean calls, with a higher 't' value (1.8) leading to a substantial increase in Lean calls compared to a 't' value of 1.5. The number of tactics (10 vs 20) does not appear to have a significant impact when t=1.5.