\n
## Bar Chart: Lean Calls Comparison by Method
### Overview
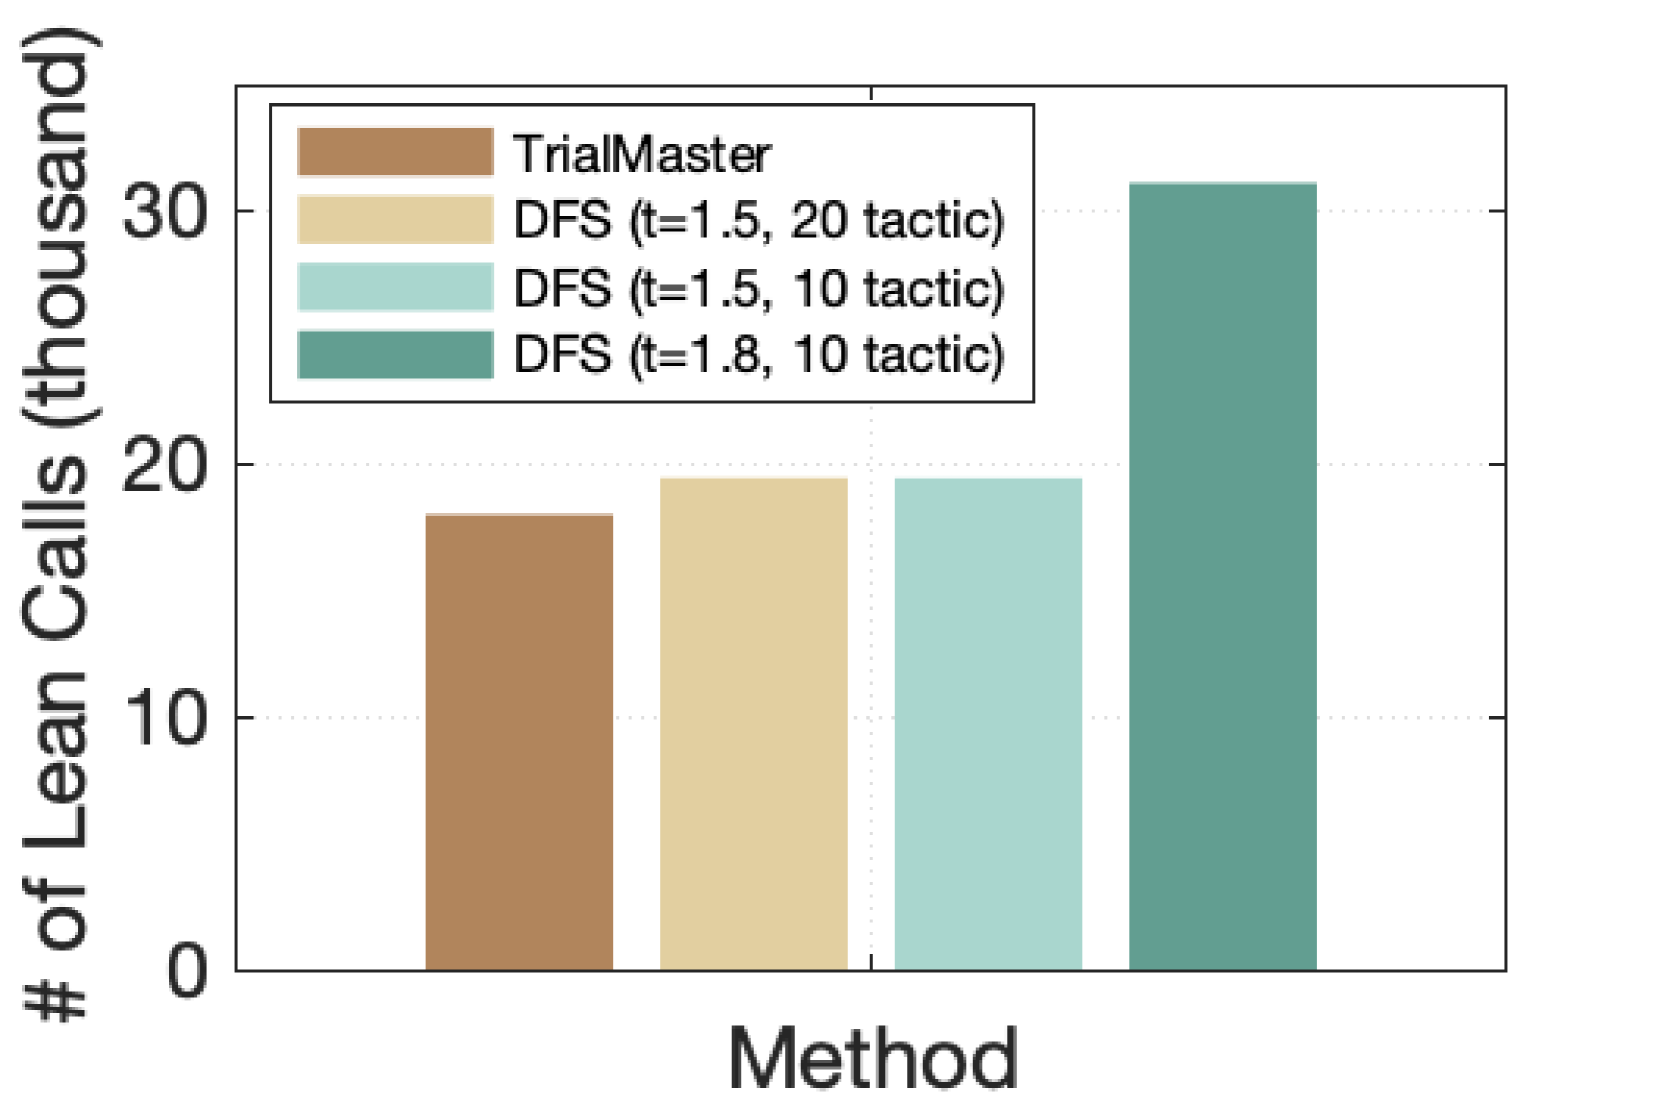
This bar chart compares the number of lean calls (in thousands) across four different methods: TrialMaster, DFS (t=1.5, 20 tactic), DFS (t=1.5, 10 tactic), and DFS (t=1.8, 10 tactic). The chart uses vertical bars to represent the number of lean calls for each method.
### Components/Axes
* **X-axis:** "Method" - Categorical axis representing the different methods being compared.
* **Y-axis:** "# of Lean Calls (thousand)" - Numerical axis representing the number of lean calls, scaled in thousands. The scale ranges from 0 to 35, with tick marks at 0, 10, 20, and 30.
* **Legend:** Located in the top-left corner of the chart. It maps colors to methods:
* TrialMaster: Light Brown
* DFS (t=1.5, 20 tactic): Light Orange
* DFS (t=1.5, 10 tactic): Light Green
* DFS (t=1.8, 10 tactic): Dark Green
### Detailed Analysis
The chart consists of four bars, one for each method.
* **TrialMaster (Light Brown):** The bar reaches approximately 18 thousand lean calls.
* **DFS (t=1.5, 20 tactic) (Light Orange):** The bar reaches approximately 28 thousand lean calls.
* **DFS (t=1.5, 10 tactic) (Light Green):** The bar reaches approximately 31 thousand lean calls.
* **DFS (t=1.8, 10 tactic) (Dark Green):** The bar reaches approximately 32 thousand lean calls.
### Key Observations
* The DFS methods consistently outperform TrialMaster in terms of the number of lean calls.
* DFS (t=1.8, 10 tactic) has the highest number of lean calls, followed closely by DFS (t=1.5, 10 tactic).
* The difference between DFS (t=1.5, 20 tactic) and TrialMaster is significant, approximately 10 thousand lean calls.
### Interpretation
The data suggests that the DFS methods are more effective at generating lean calls than the TrialMaster method. Increasing the 't' value from 1.5 to 1.8, while keeping the tactic at 10, results in a slight increase in lean calls. The tactic value (20 vs 10) appears to have a smaller impact than the 't' value. This could indicate that the parameter 't' plays a more crucial role in the efficiency of the DFS method for generating lean calls. The chart provides a clear comparison of the performance of different methods, allowing for informed decision-making regarding which method to employ for maximizing lean call generation. The data does not provide information on the *quality* of the lean calls, only the *quantity*. Further investigation would be needed to determine if the increased number of lean calls from DFS methods translates to improved outcomes.