## Line Charts: Reward vs. Episode Number for Different Levels
### Overview
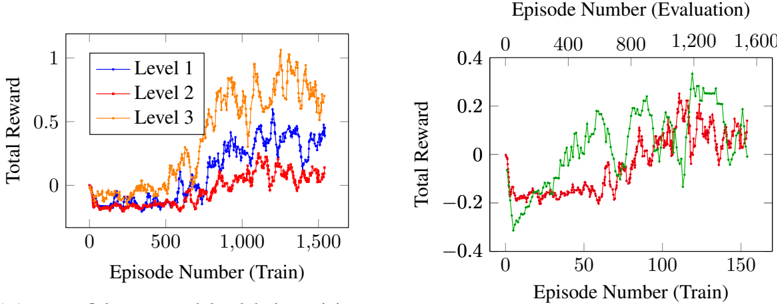
The image contains two line charts showing the "Total Reward" versus "Episode Number". The left chart displays the reward during training for three different levels (Level 1, Level 2, and Level 3). The right chart displays the reward during evaluation, with a different scale for the x-axis (Episode Number).
### Components/Axes
**Left Chart:**
* **Title:** Implicit, but represents training performance.
* **Y-axis:** "Total Reward", ranging from 0 to 1.
* **X-axis:** "Episode Number (Train)", ranging from 0 to 1500.
* **Legend (Top-Left):**
* Blue line: "Level 1"
* Red line: "Level 2"
* Orange line: "Level 3"
**Right Chart:**
* **Title:** Implicit, but represents evaluation performance.
* **Y-axis:** "Total Reward", ranging from -0.4 to 0.4.
* **X-axis (Bottom):** "Episode Number (Train)", ranging from 0 to 150.
* **X-axis (Top):** "Episode Number (Evaluation)", ranging from 0 to 1600.
* **Legend:**
* Green line: Corresponds to Level 1
* Red line: Corresponds to Level 2
### Detailed Analysis
**Left Chart (Training):**
* **Level 1 (Blue):** Initially fluctuates around 0, then starts to increase around episode 750, reaching approximately 0.4 around episode 1000, and then fluctuates between 0.2 and 0.5 until episode 1500.
* **Level 2 (Red):** Initially fluctuates around -0.2, then starts to increase around episode 750, reaching approximately 0.2 around episode 1000, and then fluctuates between 0 and 0.3 until episode 1500.
* **Level 3 (Orange):** Initially fluctuates around 0, then starts to increase around episode 500, reaching approximately 0.8 around episode 750, and then fluctuates between 0.6 and 1 until episode 1500.
**Right Chart (Evaluation):**
* **Level 1 (Green):** Starts at approximately -0.35, increases rapidly to around 0 by episode 25, and then fluctuates between 0 and 0.3 until episode 150.
* **Level 2 (Red):** Starts at approximately -0.2, decreases to around -0.3 by episode 10, increases to around 0 by episode 50, and then fluctuates between -0.2 and 0.2 until episode 150.
### Key Observations
* In the training phase, Level 3 consistently achieves the highest total reward, followed by Level 1 and then Level 2.
* The training reward for all levels increases significantly after approximately 500-750 episodes.
* In the evaluation phase, Level 1 initially performs poorly but quickly improves, surpassing Level 2.
* The evaluation reward fluctuates significantly for both levels.
### Interpretation
The charts suggest that the agent learns to perform better on all levels as the number of training episodes increases. Level 3 appears to be the easiest to learn, as it achieves a high reward earlier in the training process. The evaluation chart indicates that the agent's performance on unseen episodes is initially poor but improves with training, although it remains volatile. The difference in performance between the training and evaluation phases suggests that the agent may be overfitting to the training data, especially for Level 2. The evaluation chart uses a different x-axis on the top, which could be useful for comparing the performance across different training regimes or environments.