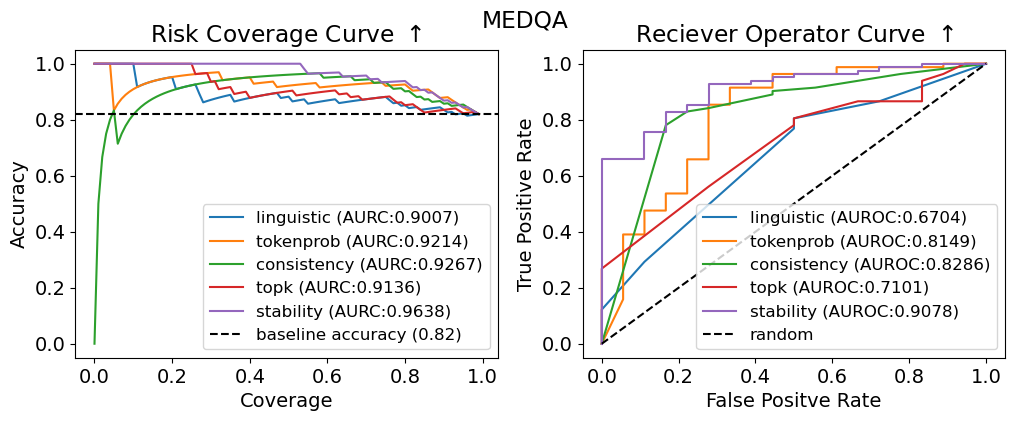
## Chart Type: Comparative Analysis of Risk Coverage and Receiver Operator Curves
### Overview
The image presents two charts side-by-side, both related to the MEDQA dataset. The left chart is a "Risk Coverage Curve," displaying accuracy as a function of coverage for different methods. The right chart is a "Receiver Operator Curve," showing the true positive rate against the false positive rate. Both charts compare the performance of 'linguistic', 'tokenprob', 'consistency', 'topk', and 'stability' methods.
### Components/Axes
**Left Chart: Risk Coverage Curve**
* **Title:** Risk Coverage Curve ↑
* **Y-axis:** Accuracy, ranging from 0.0 to 1.0 in increments of 0.2.
* **X-axis:** Coverage, ranging from 0.0 to 1.0 in increments of 0.2.
* **Legend (bottom-center):**
* linguistic (AURC:0.9007) - Blue line
* tokenprob (AURC:0.9214) - Orange line
* consistency (AURC:0.9267) - Green line
* topk (AURC:0.9136) - Red line
* stability (AURC:0.9638) - Purple line
* baseline accuracy (0.82) - Dashed black line
**Right Chart: Receiver Operator Curve**
* **Title:** Reciever Operator Curve ↑
* **Y-axis:** True Positive Rate, ranging from 0.0 to 1.0 in increments of 0.2.
* **X-axis:** False Positive Rate, ranging from 0.0 to 1.0 in increments of 0.2.
* **Legend (bottom-center):**
* linguistic (AUROC:0.6704) - Blue line
* tokenprob (AUROC:0.8149) - Orange line
* consistency (AUROC:0.8286) - Green line
* topk (AUROC:0.7101) - Red line
* stability (AUROC:0.9078) - Purple line
* random - Dashed black line
### Detailed Analysis
**Left Chart: Risk Coverage Curve**
* **baseline accuracy:** A horizontal dashed black line at approximately 0.82.
* **linguistic (AURC:0.9007):** The blue line starts at approximately 0.75 accuracy at 0 coverage, rises sharply, and then gradually decreases to approximately 0.85 accuracy at 1.0 coverage.
* **tokenprob (AURC:0.9214):** The orange line starts at approximately 0.70 accuracy at 0 coverage, rises sharply, and then gradually decreases to approximately 0.90 accuracy at 1.0 coverage.
* **consistency (AURC:0.9267):** The green line starts at approximately 0.0 accuracy at 0 coverage, rises sharply to approximately 0.90 accuracy at 0.1 coverage, and then gradually decreases to approximately 0.83 accuracy at 1.0 coverage.
* **topk (AURC:0.9136):** The red line starts at approximately 0.85 accuracy at 0 coverage, and then gradually decreases to approximately 0.83 accuracy at 1.0 coverage.
* **stability (AURC:0.9638):** The purple line starts at 1.0 accuracy at 0 coverage, and then remains at 1.0 accuracy until 0.1 coverage, and then gradually decreases to approximately 0.92 accuracy at 1.0 coverage.
**Right Chart: Receiver Operator Curve**
* **random:** A dashed black line representing a random classifier, rising linearly from (0.0, 0.0) to (1.0, 1.0).
* **linguistic (AUROC:0.6704):** The blue line rises linearly from (0.0, 0.0) to approximately (0.8, 0.6), and then remains constant.
* **tokenprob (AUROC:0.8149):** The orange line is a step function, rising in steps from (0.0, 0.0) to approximately (0.8, 0.9).
* **consistency (AUROC:0.8286):** The green line rises sharply from (0.0, 0.0) to approximately (0.2, 0.4), then rises more gradually to approximately (0.8, 0.9).
* **topk (AUROC:0.7101):** The red line rises sharply from (0.0, 0.0) to approximately (0.2, 0.3), then rises more gradually to approximately (0.8, 0.9).
* **stability (AUROC:0.9078):** The purple line is a step function, rising in steps from (0.0, 0.0) to approximately (0.2, 0.7), and then to approximately (0.9, 1.0).
### Key Observations
* In the Risk Coverage Curve, 'stability' consistently maintains the highest accuracy across different coverage levels, while 'consistency' starts with low accuracy but improves rapidly with increasing coverage.
* In the Receiver Operator Curve, 'stability' also demonstrates the best performance, closely followed by 'consistency' and 'tokenprob'. 'linguistic' and 'topk' perform relatively worse.
* The baseline accuracy in the Risk Coverage Curve is approximately 0.82.
### Interpretation
The charts provide a comparative analysis of different methods ('linguistic', 'tokenprob', 'consistency', 'topk', and 'stability') in the context of the MEDQA dataset. The Risk Coverage Curve illustrates how accuracy changes with increasing coverage, while the Receiver Operator Curve assesses the trade-off between true positive rate and false positive rate.
The 'stability' method appears to be the most effective overall, achieving high accuracy and a favorable true positive rate/false positive rate balance. 'consistency' and 'tokenprob' also perform well, while 'linguistic' and 'topk' show relatively weaker performance. The baseline accuracy in the Risk Coverage Curve provides a benchmark for evaluating the performance of these methods. The AUROC values in the legend quantify the overall performance of each method in the Receiver Operator Curve.