# Technical Document Extraction: Heatmap Analysis
## Image Overview
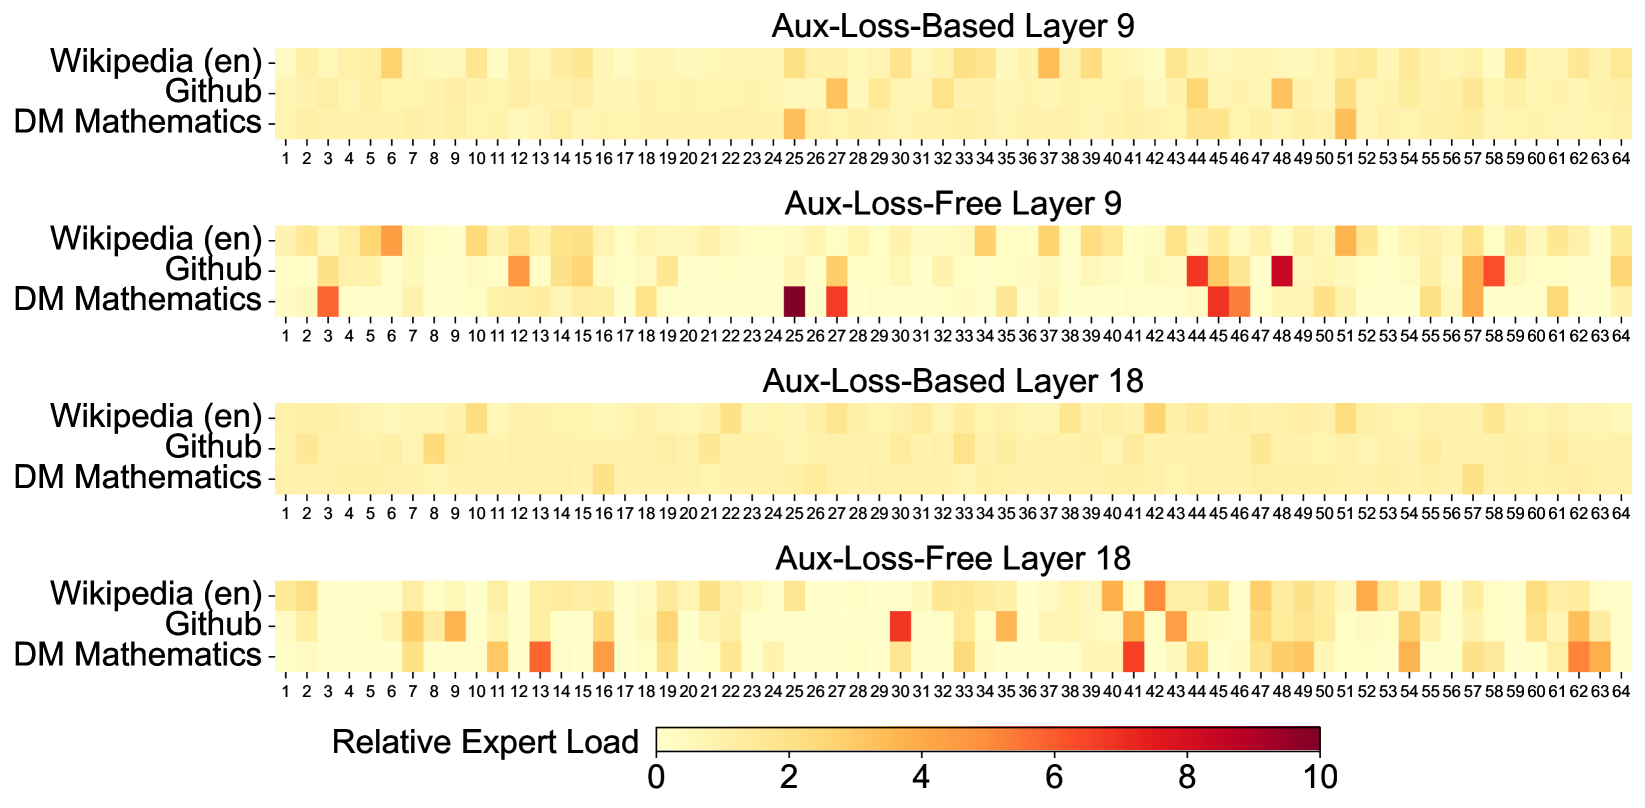
The image contains **four heatmaps** comparing **relative expert load** across three datasets (`Wikipedia (en)`, `Github`, `DM Mathematics`) for two neural network layers (`Layer 9` and `Layer 18`) under two training conditions (`Aux-Loss-Based` and `Aux-Loss-Free`). Color intensity represents the magnitude of expert load, with a scale from **0 (light yellow)** to **10 (dark red)**.
---
## Key Components
### Axis Labels
- **Y-Axis**:
Categories:
- `Wikipedia (en)`
- `Github`
- `DM Mathematics`
- **X-Axis**:
Feature indices:
`1, 2, 3, ..., 64` (likely representing feature dimensions or token positions).
- **Legend**:
- **Title**: `Relative Expert Load`
- **Scale**: `0 → 10` (light yellow → dark red).
---
## Heatmap Details
### 1. **Aux-Loss-Based Layer 9**
- **Structure**:
- **Y-Axis**: `Wikipedia (en)`, `Github`, `DM Mathematics`.
- **X-Axis**: Feature indices `1–64`.
- **Color Distribution**:
- Predominantly **light yellow** (low expert load).
- Sparse **orange** regions (moderate load) in `Github` and `DM Mathematics`.
- No **red** regions (high load).
### 2. **Aux-Loss-Free Layer 9**
- **Structure**:
- **Y-Axis**: Same as above.
- **X-Axis**: Same as above.
- **Color Distribution**:
- **Dark red** squares concentrated in:
- `Github` (indices ~12, 25, 48, 51).
- `DM Mathematics` (indices ~45, 50).
- **Orange** regions in `Wikipedia (en)` (indices ~15, 35, 58).
### 3. **Aux-Loss-Based Layer 18**
- **Structure**:
- **Y-Axis**: Same as above.
- **X-Axis**: Same as above.
- **Color Distribution**:
- Uniform **light yellow** across all datasets and features.
- No significant orange/red regions.
### 4. **Aux-Loss-Free Layer 18**
- **Structure**:
- **Y-Axis**: Same as above.
- **X-Axis**: Same as above.
- **Color Distribution**:
- **Dark red** squares in:
- `Github` (indices ~15, 35, 58).
- `DM Mathematics` (indices ~45, 61).
- **Orange** regions in `Wikipedia (en)` (indices ~12, 30, 55).
---
## Observations
1. **Layer 9 vs. Layer 18**:
- Layer 9 shows more concentrated high-load regions (red/orange) in `Aux-Loss-Free` conditions.
- Layer 18 exhibits sparser high-load regions, suggesting reduced reliance on specific features.
2. **Dataset-Specific Patterns**:
- `Github` consistently shows higher expert load in `Aux-Loss-Free` layers.
- `DM Mathematics` has localized high-load regions in both layers but more pronounced in `Aux-Loss-Free`.
3. **Training Condition Impact**:
- `Aux-Loss-Free` layers exhibit significantly higher expert load (red regions) compared to `Aux-Loss-Based` layers.
---
## Data Extraction Summary
| Layer Type | Dataset | High-Load Feature Indices |
|---------------------|------------------|---------------------------|
| Aux-Loss-Based L9 | Github | ~12, 25 |
| Aux-Loss-Free L9 | Github | ~12, 25, 48, 51 |
| Aux-Loss-Free L9 | DM Mathematics | ~45, 50 |
| Aux-Loss-Free L18 | Github | ~15, 35, 58 |
| Aux-Loss-Free L18 | DM Mathematics | ~45, 61 |
---
## Notes
- **Color Consistency**: Red regions in heatmaps align with the legend's upper range (8–10).
- **Missing Data**: No explicit numerical values provided; analysis based on visual intensity.
- **Assumptions**: Feature indices (`1–64`) likely correspond to token/feature positions in the datasets.