# Technical Document Extraction: Expert Load Heatmaps
## 1. Document Overview
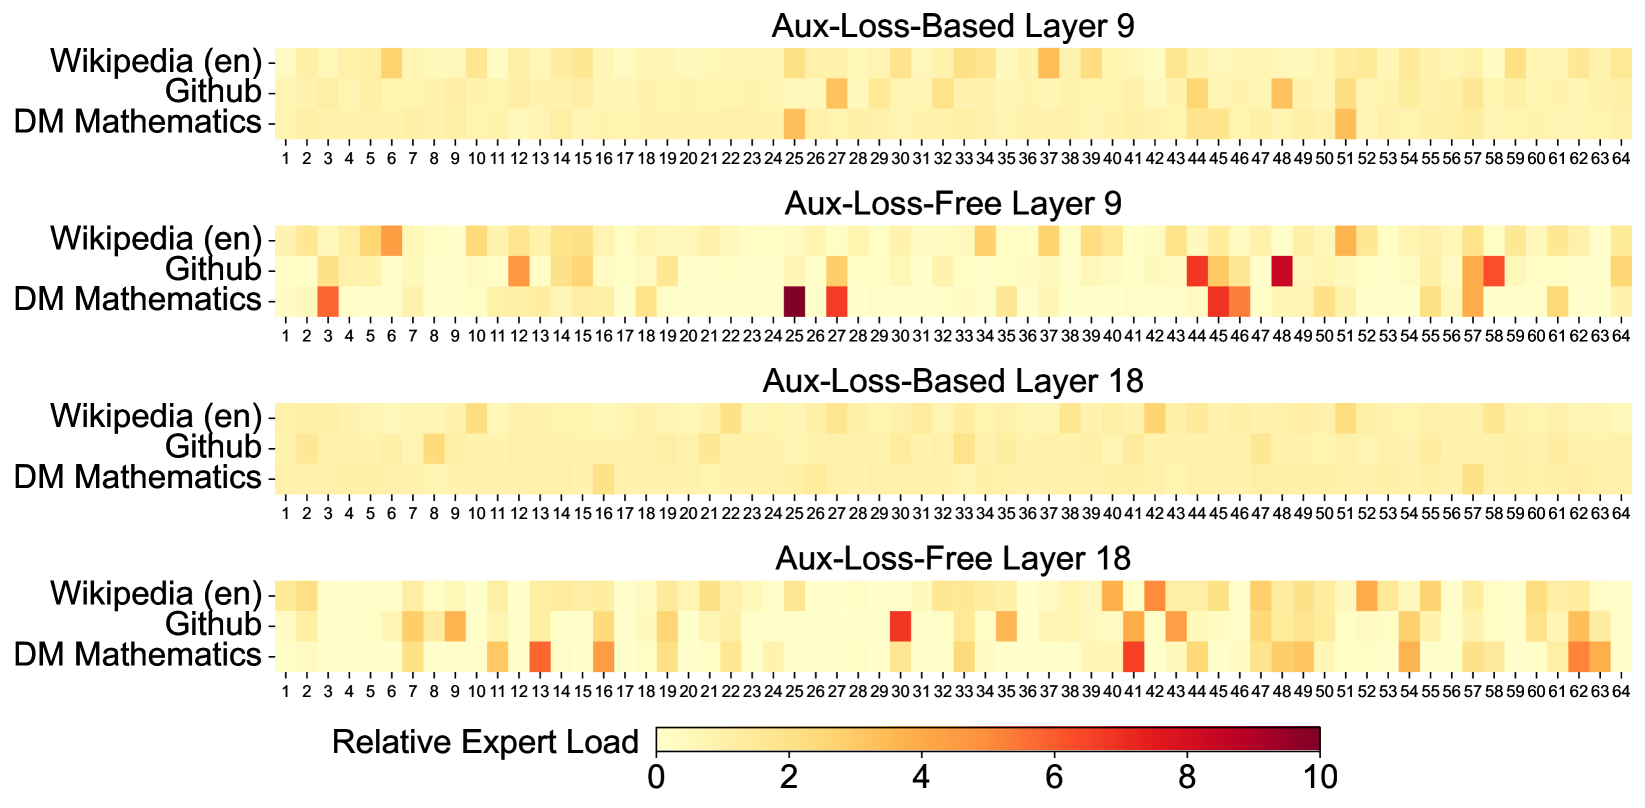
This image contains four heatmaps visualizing the "Relative Expert Load" across 64 different experts for three specific datasets. The data compares two different model training methodologies (Aux-Loss-Based vs. Aux-Loss-Free) at two different depths within a neural network (Layer 9 and Layer 18).
## 2. Global Components
### Legend (Footer)
* **Location:** Bottom center of the image.
* **Title:** Relative Expert Load
* **Scale:** Continuous color gradient.
* **0 (Light Yellow):** Low relative load.
* **10 (Dark Red/Maroon):** High relative load.
* **Markers:** 0, 2, 4, 6, 8, 10.
### Axis Definitions (Common to all charts)
* **Y-Axis (Categories):**
1. Wikipedia (en)
2. Github
3. DM Mathematics
* **X-Axis (Experts):**
* Numbered 1 through 64.
---
## 3. Heatmap Analysis
### Chart 1: Aux-Loss-Based Layer 9
* **Trend:** This chart shows a highly uniform distribution. Most experts have a load near 0 (light yellow). There are very few "hot spots," suggesting the auxiliary loss successfully balanced the load across experts.
* **Key Data Points:**
* **Wikipedia (en):** Slight activity at Expert 6 and Expert 25.
* **Github:** Slight activity at Expert 27, 44, and 48.
* **DM Mathematics:** Slight activity at Expert 25 and 51.
### Chart 2: Aux-Loss-Free Layer 9
* **Trend:** Significant specialization and load imbalance compared to the Aux-Loss-Based version. Several experts show high intensity (orange to dark red), indicating they are being heavily utilized by specific datasets while others are ignored.
* **Key Data Points:**
* **Wikipedia (en):** Moderate load at Expert 6 and 51.
* **Github:** High load (Red) at Expert 44 and 48. Moderate load at Expert 12, 27, and 58.
* **DM Mathematics:** Very high load (Dark Red/Maroon) at Expert 25. High load (Orange/Red) at Expert 3, 27, 45, and 46.
### Chart 3: Aux-Loss-Based Layer 18
* **Trend:** The most uniform of all four charts. The expert load is almost perfectly distributed with nearly no visible variation in the light yellow color.
* **Key Data Points:**
* Minimal visible peaks. Very slight shading at Expert 10 (Github) and Expert 16 (DM Mathematics).
### Chart 4: Aux-Loss-Free Layer 18
* **Trend:** Shows moderate specialization. While not as extreme as Layer 9 Aux-Loss-Free, there is clear "expert picking" where certain experts are preferred for specific tasks.
* **Key Data Points:**
* **Wikipedia (en):** Moderate load at Expert 1 and 41.
* **Github:** High load (Red) at Expert 30. Moderate load at Expert 42.
* **DM Mathematics:** High load (Orange/Red) at Expert 13, 16, 41, and 62.
---
## 4. Comparative Summary
| Feature | Aux-Loss-Based | Aux-Loss-Free |
| :--- | :--- | :--- |
| **Expert Distribution** | Highly uniform; low variance. | Highly specialized; high variance. |
| **Peak Load Values** | Rarely exceeds 2-3 on the scale. | Frequently reaches 8-10 on the scale. |
| **Layer 9 vs 18** | Layer 18 is more uniform than Layer 9. | Both layers show significant "hot spots," but patterns differ. |
**Conclusion:** The "Aux-Loss-Based" method effectively prevents expert collapse and ensures a balanced workload across all 64 experts. The "Aux-Loss-Free" method allows the model to naturally gravitate toward specific experts for specific data types (e.g., Expert 25 for DM Mathematics in Layer 9), resulting in much higher relative loads on a subset of the available experts.